
What Makes a Drawing Human? Accumulation, Attention, and the Limits of Computation
A post about making & viewing images while comparing machine vision & the human hand

I’m thinking a lot about the differences between calculated images and accumulated images, mainly the computational models I run on photosets to calculate standard deviation compared to more human ways of producing an image, like drawing with a pencil. How does the act of producing an image shape what we pay attention to?
I’ve been processing my recent sculpture Everglades Cord and the way that this object operates as a machine for tuning attention to detail through slow looking which I wrote about here. There’s more to say about that, but I’m writing today about a parallel translational work that I produced during deinstallation this past August.
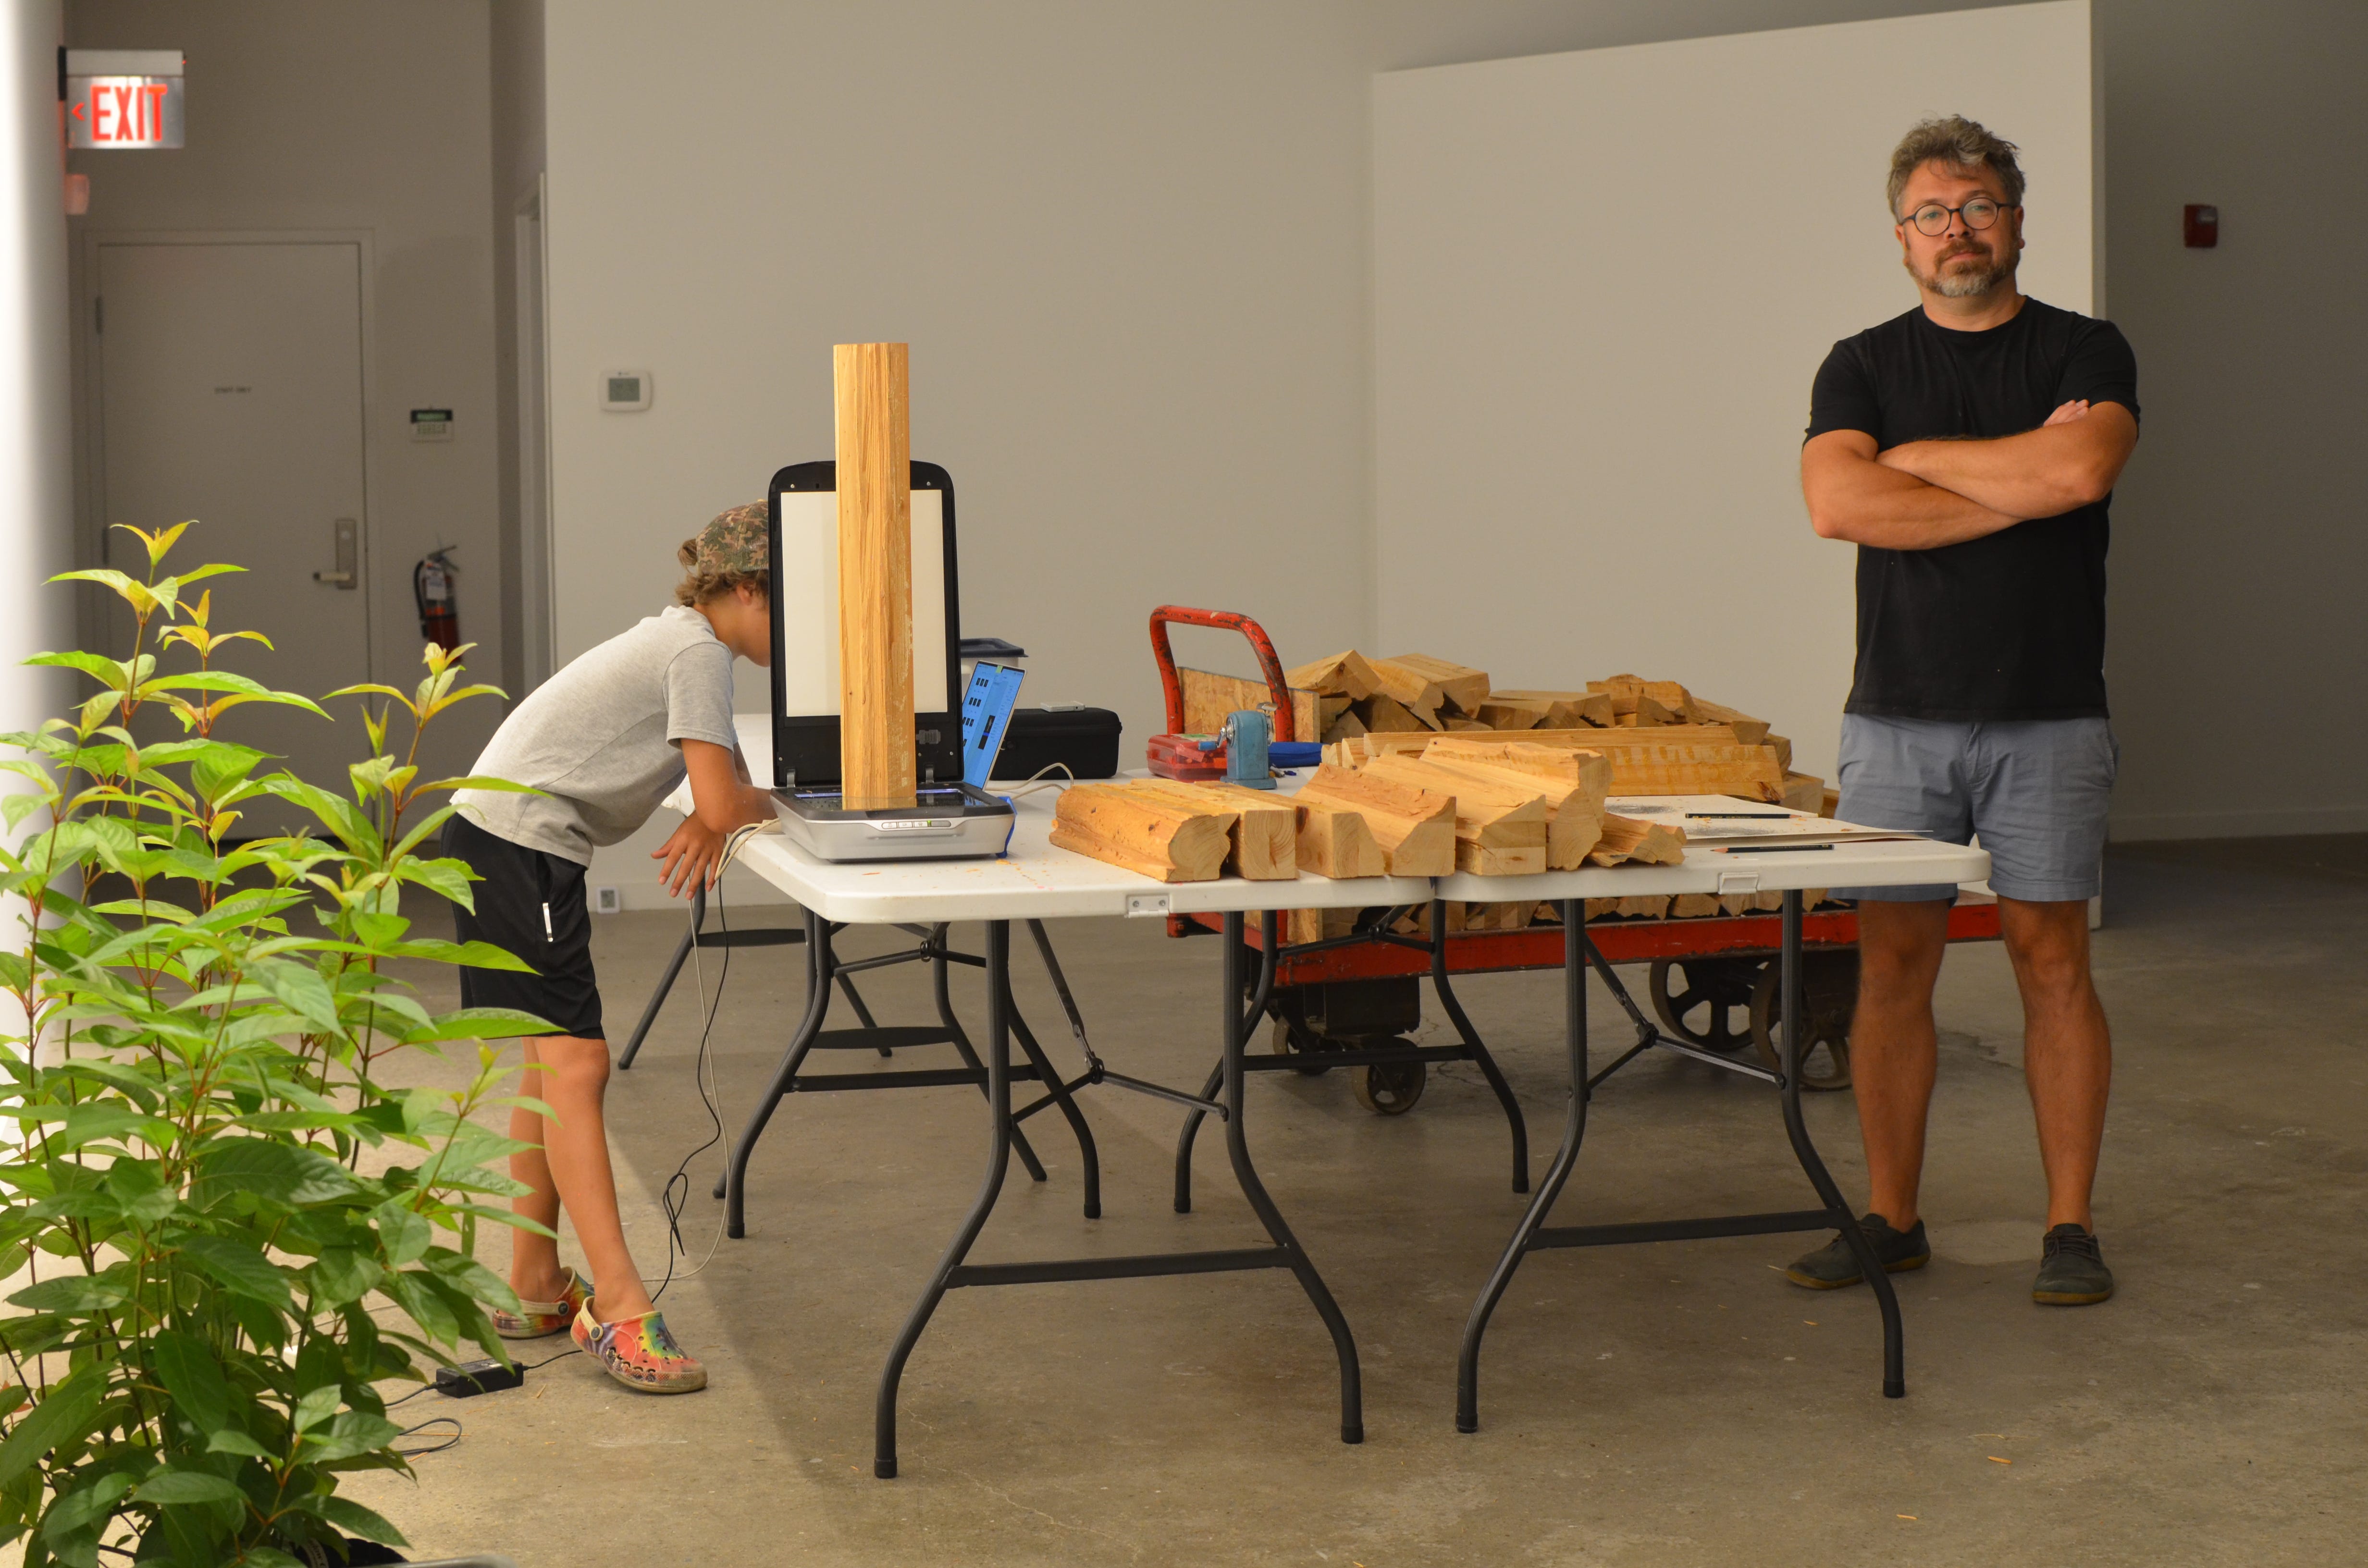
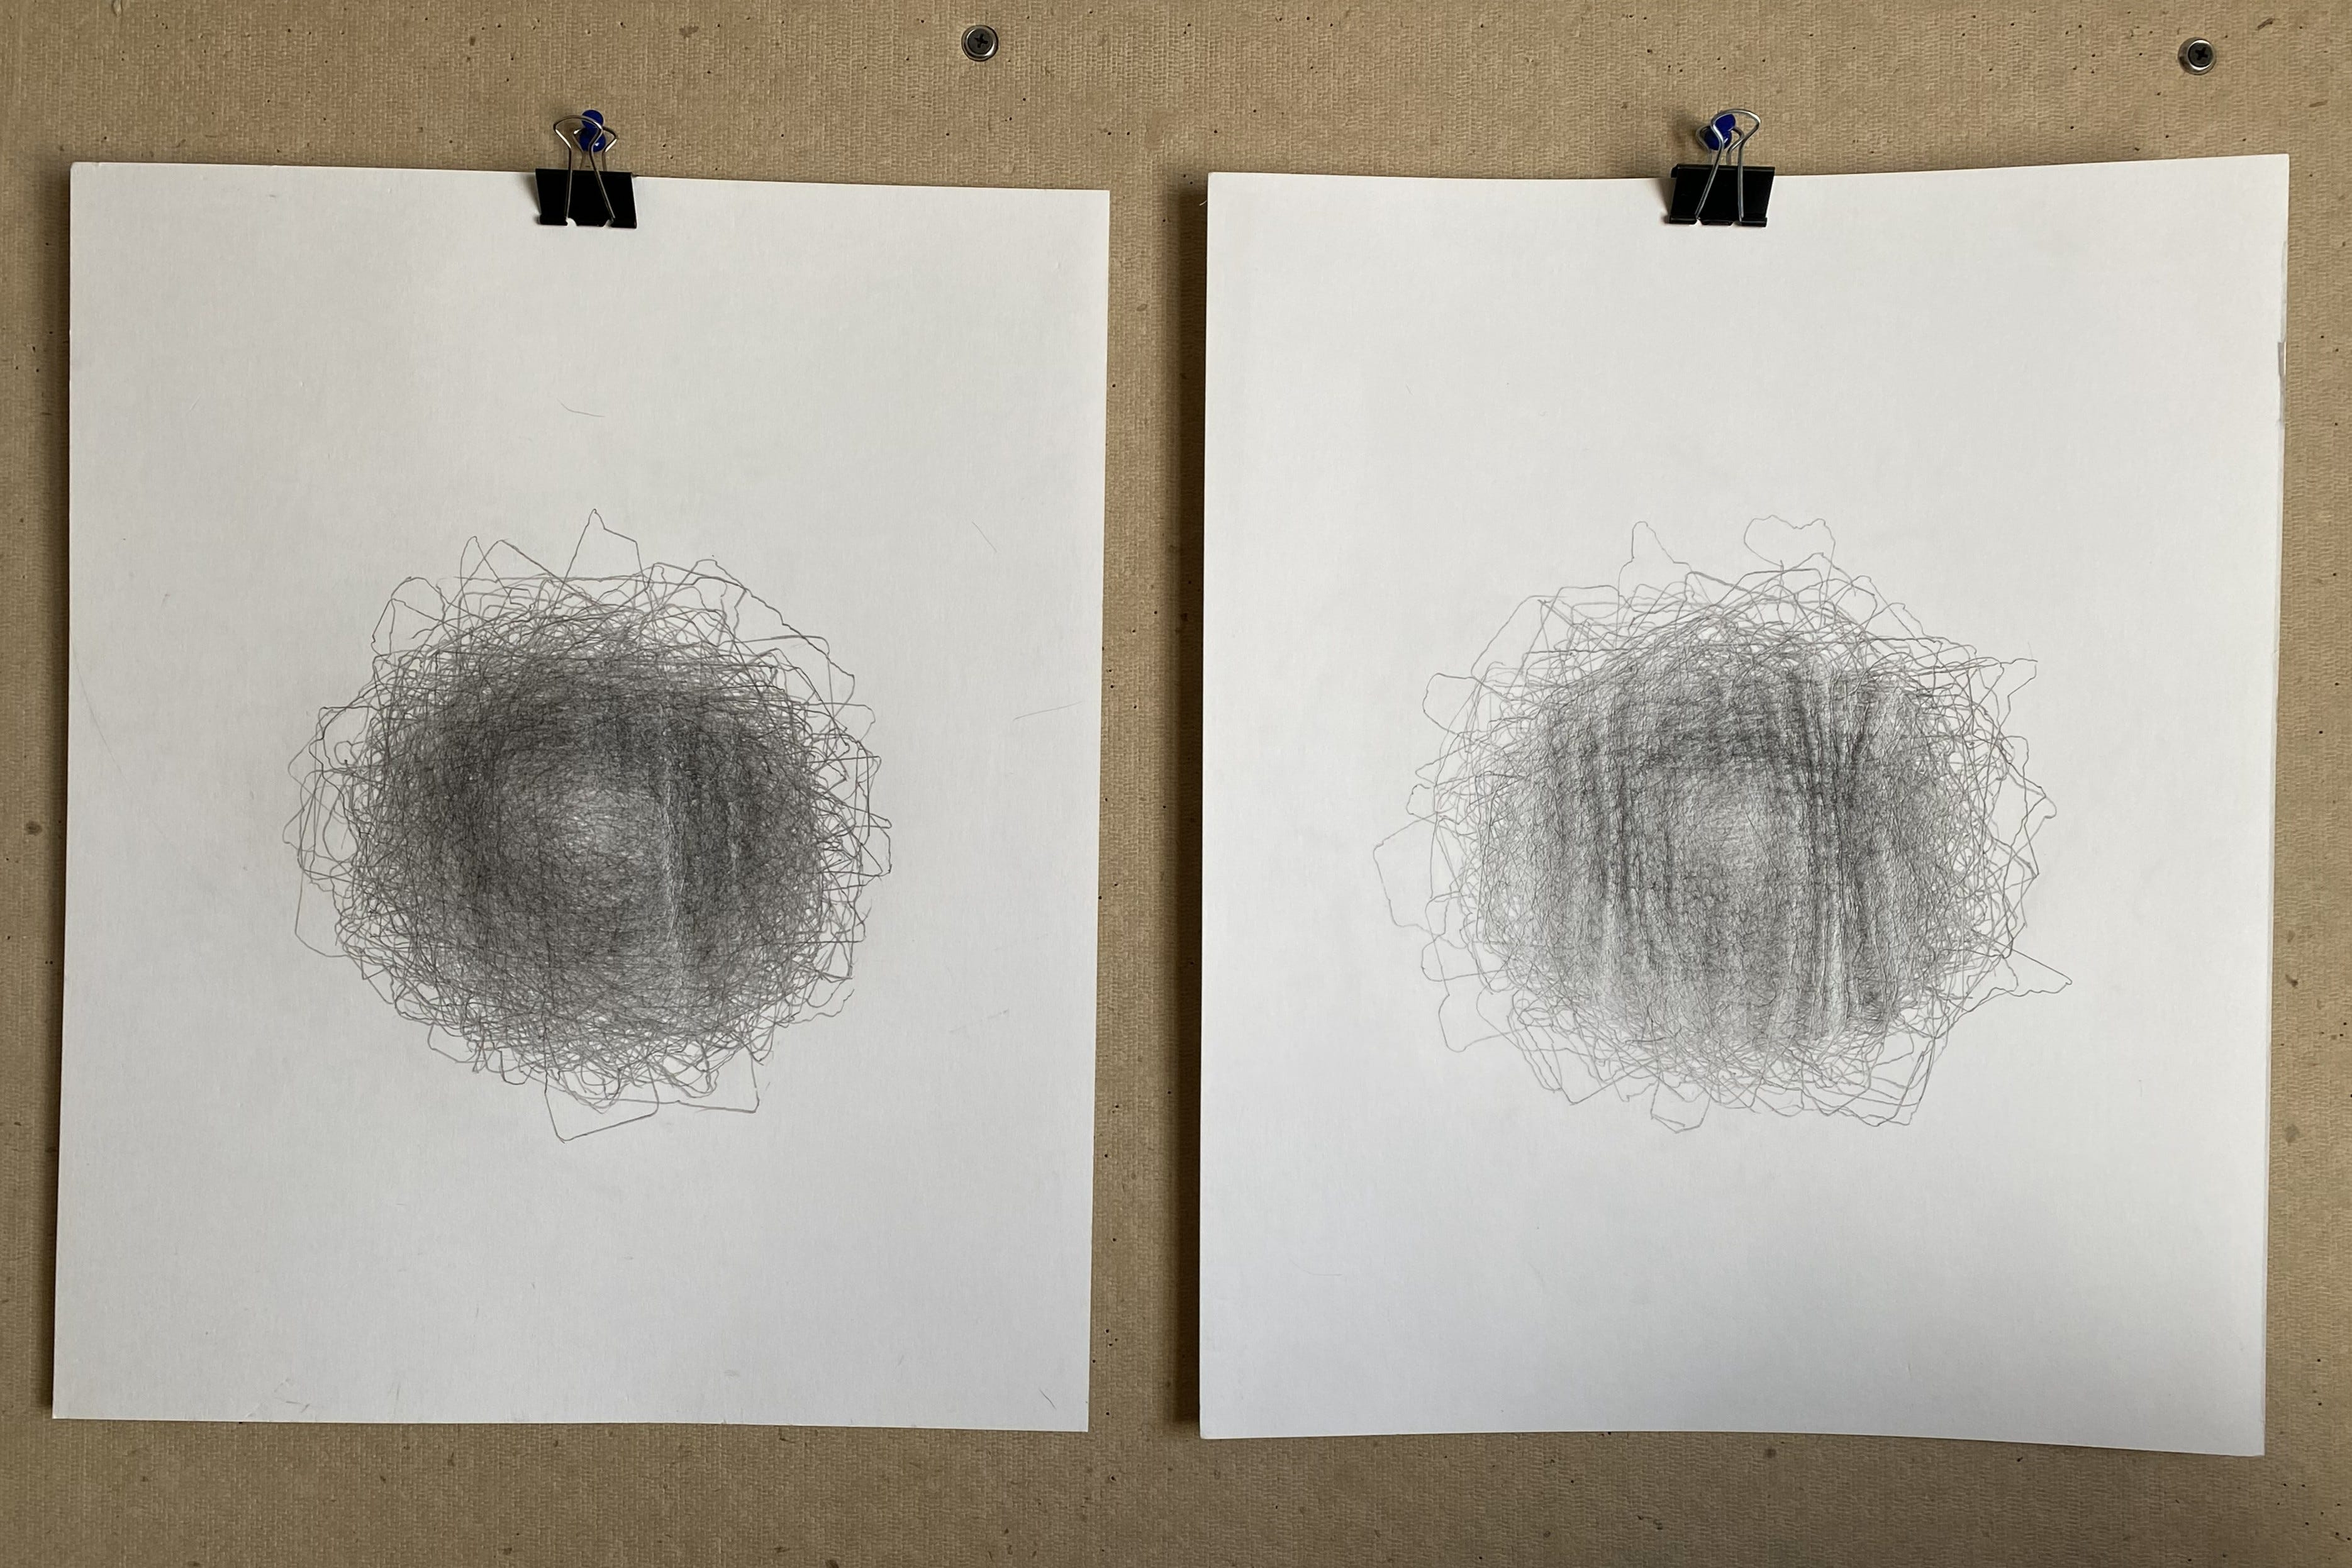
During deinstallation, my son scanned both ends of each log using a flatbed scanner. As he finished each log, I would then trace the outline by hand, stacking the contours on a single sheet. The drawing carries both gestures: one procedural and delegated, the other embodied and durational. I got two drawings from this experience which I’ll share below after I frame the significance of the comparison.
I had wanted to see if I could approximate an analog image for these logs that communicated some of the same results I was deriving from the computational models I was running on the glacial stones I had been mapping on Kelleys Island.
What i ended up with was a remembrance of the importance of being human.
View a video sequence of all 754 scans in order on Instagram
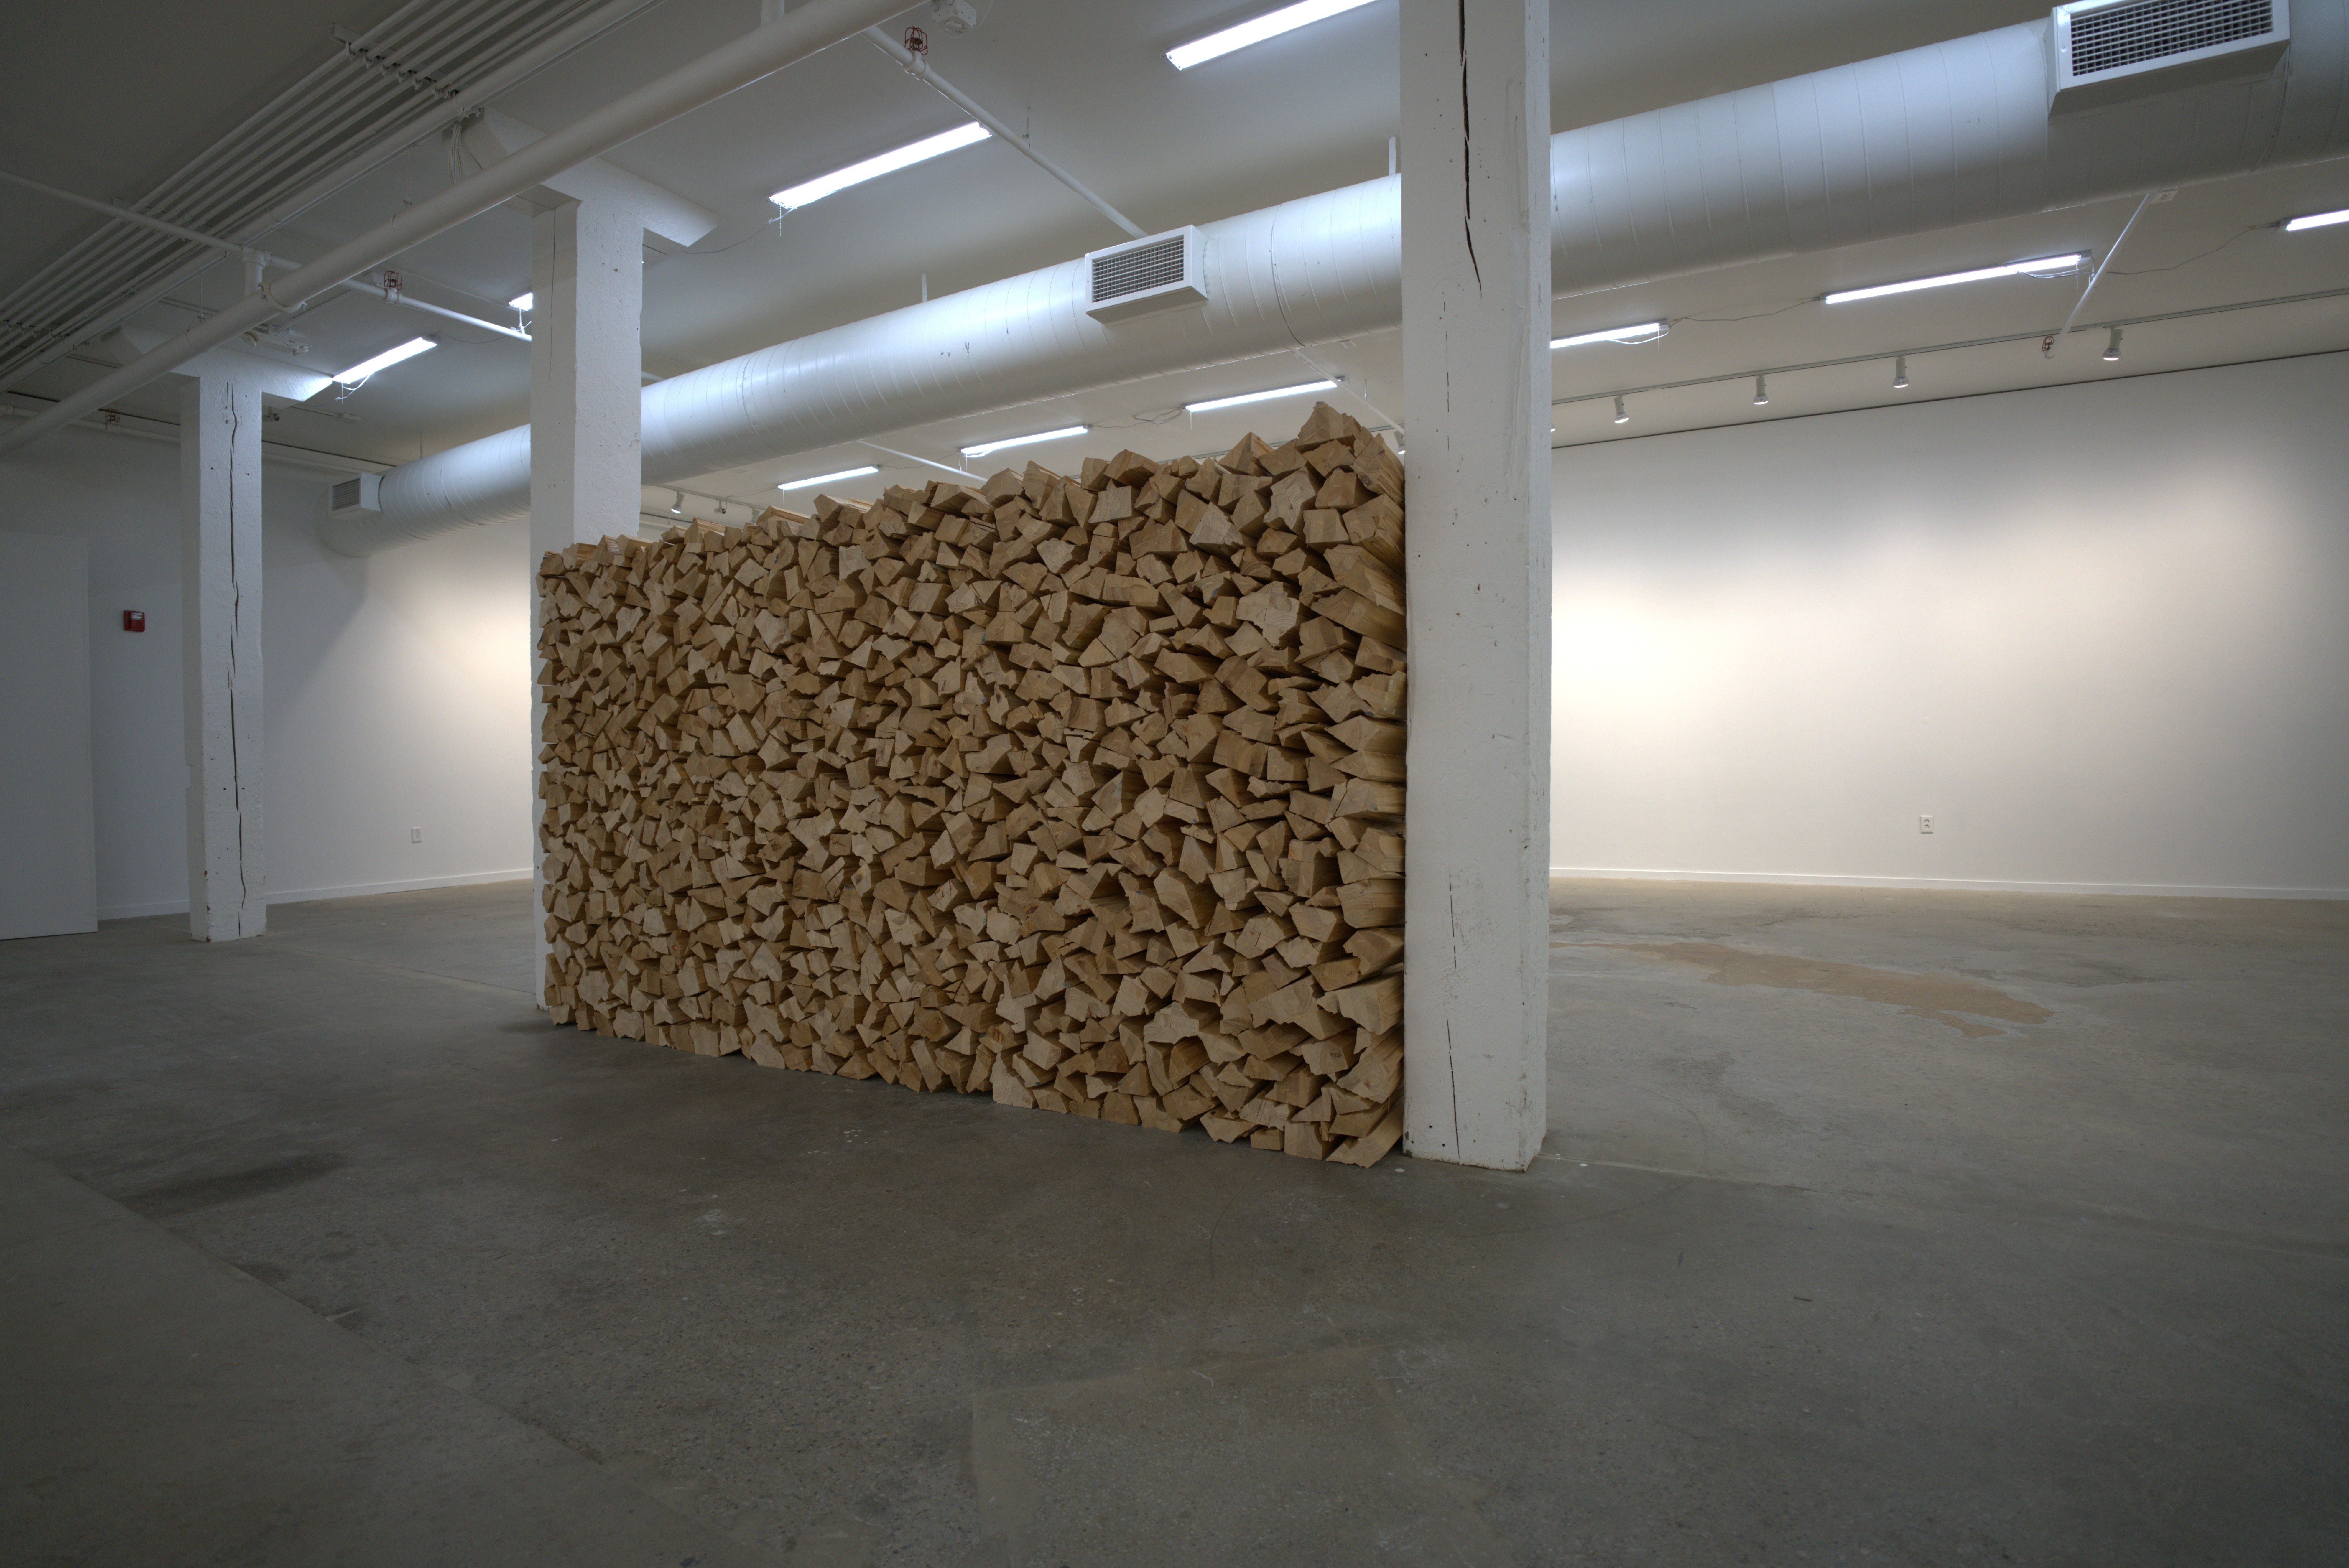
Everglades Cord (2025) presents itself as a stack of firewood, but this apparent familiarity is a misdirection: each log is hand-made through a deliberate combination of precision joinery and the blunt force of an axe. Through close looking and sustained attention, the object resists its own category and becomes a lens for examining how human perception, touch, and intention are registered in material form. What do I mean that it resists its own category? If you look closer it tells you it is not a pile of firewood.
Here’s an installation view of the full set of logs in this dataset:
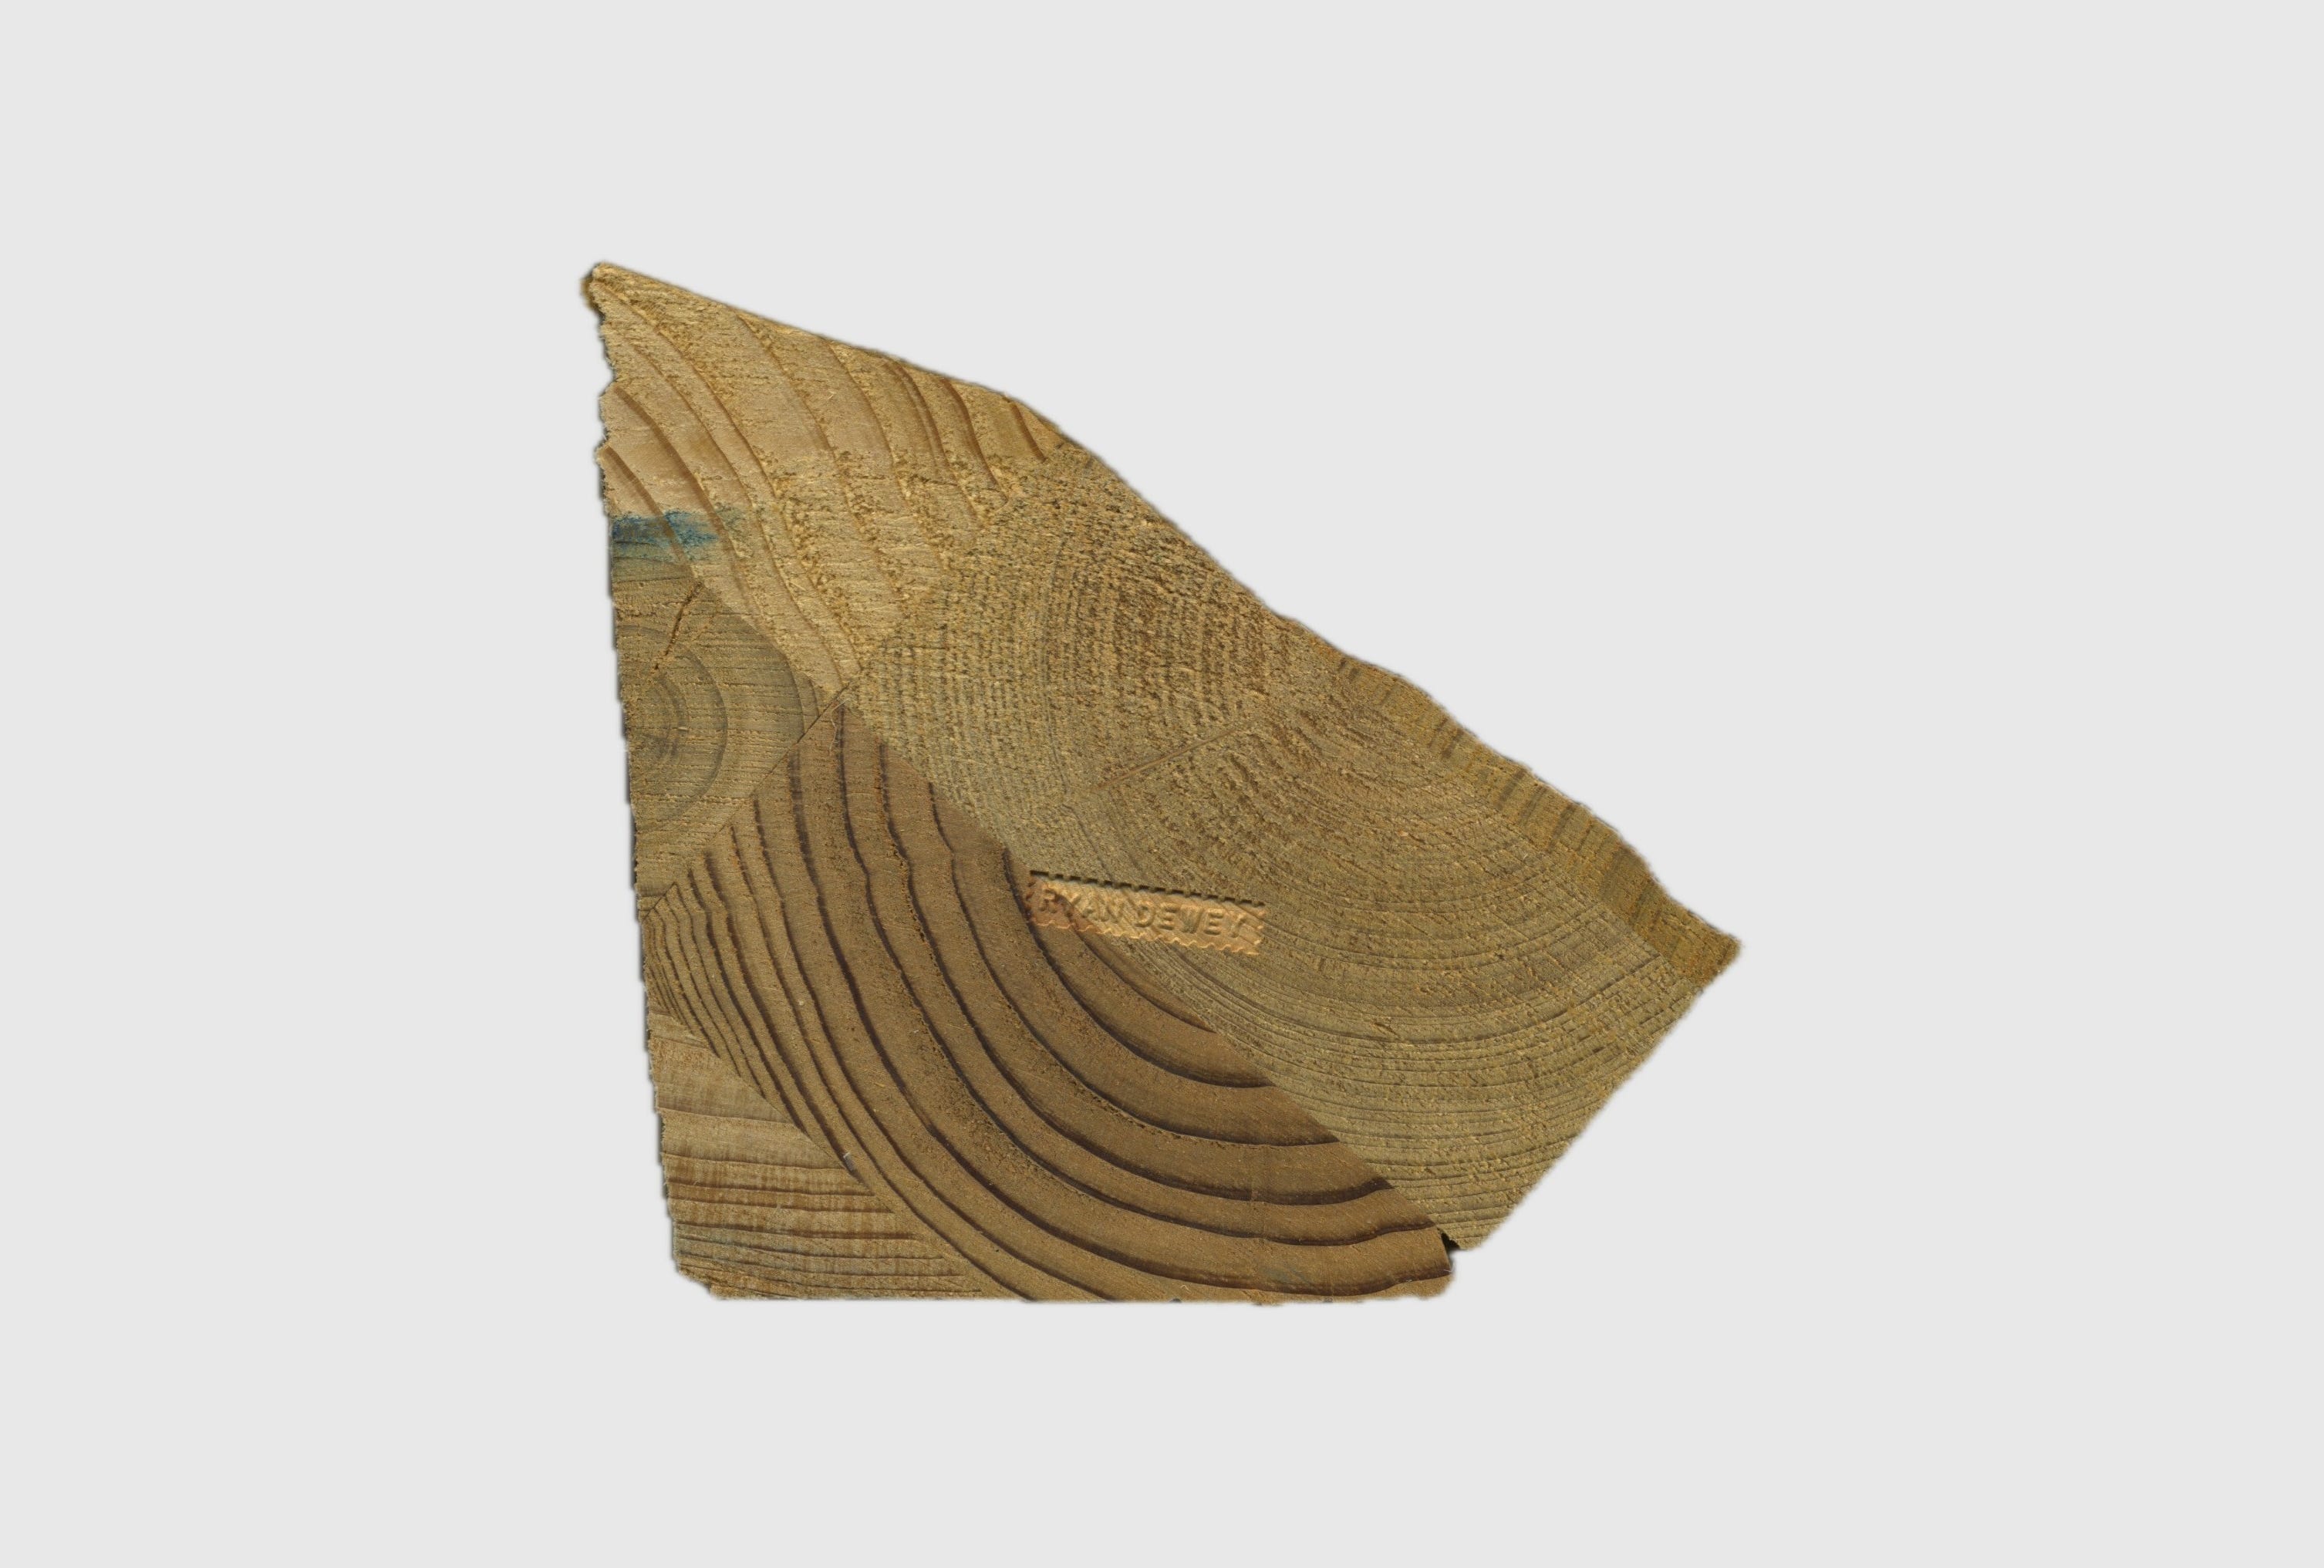
Here’s a small selection of the scanned images of the ends of logs as a reference for my input data in the computations that follow.


When I produced the standard deviation models of the glacial stones I came across on Kelleys Island (which I wrote about here), I was interested in the variety of stones as much as their shape and size. The variation in color across stones influenced the stack models I built because the pixels in the images had wide variation in color. Some stones were pink, some were yellow, some gray, some brown, some black. These color profiles indexed the bedrock lithologies in the Canadian Shield were these glacial stones originated from, so seeing the variety of color come through in the digital processing was important to me.

But I ran the same statistical models on the full set of stacked images of the logs from Everglades Cord, and those individual images have a fairly consistent color scheme because it is all cypress wood from the same source. So for these objects it was the contour edges and profiles of the end cut cross sections were more important to capture.
On the computer, stacking is literal. You place every image in the same coordinate system and ask the machine to compute something across them. A center. A boundary. A spread. Depending on the operation, you get a different answer. The average image. The median one. The darkest or lightest extreme. The statistical dispersion. Each result is correct, and each model answers a different question.
The mean image tells you where the mass settles. The median resists outliers and points to what is most typical. The minimum and maximum define the envelope of possibility. Standard deviation shows where variation concentrates and where it thins out. Skewness reveals bias in one direction or another. These are not aesthetic effects or filters, or notional impressions. They are factual descriptions of structure. It’s math.
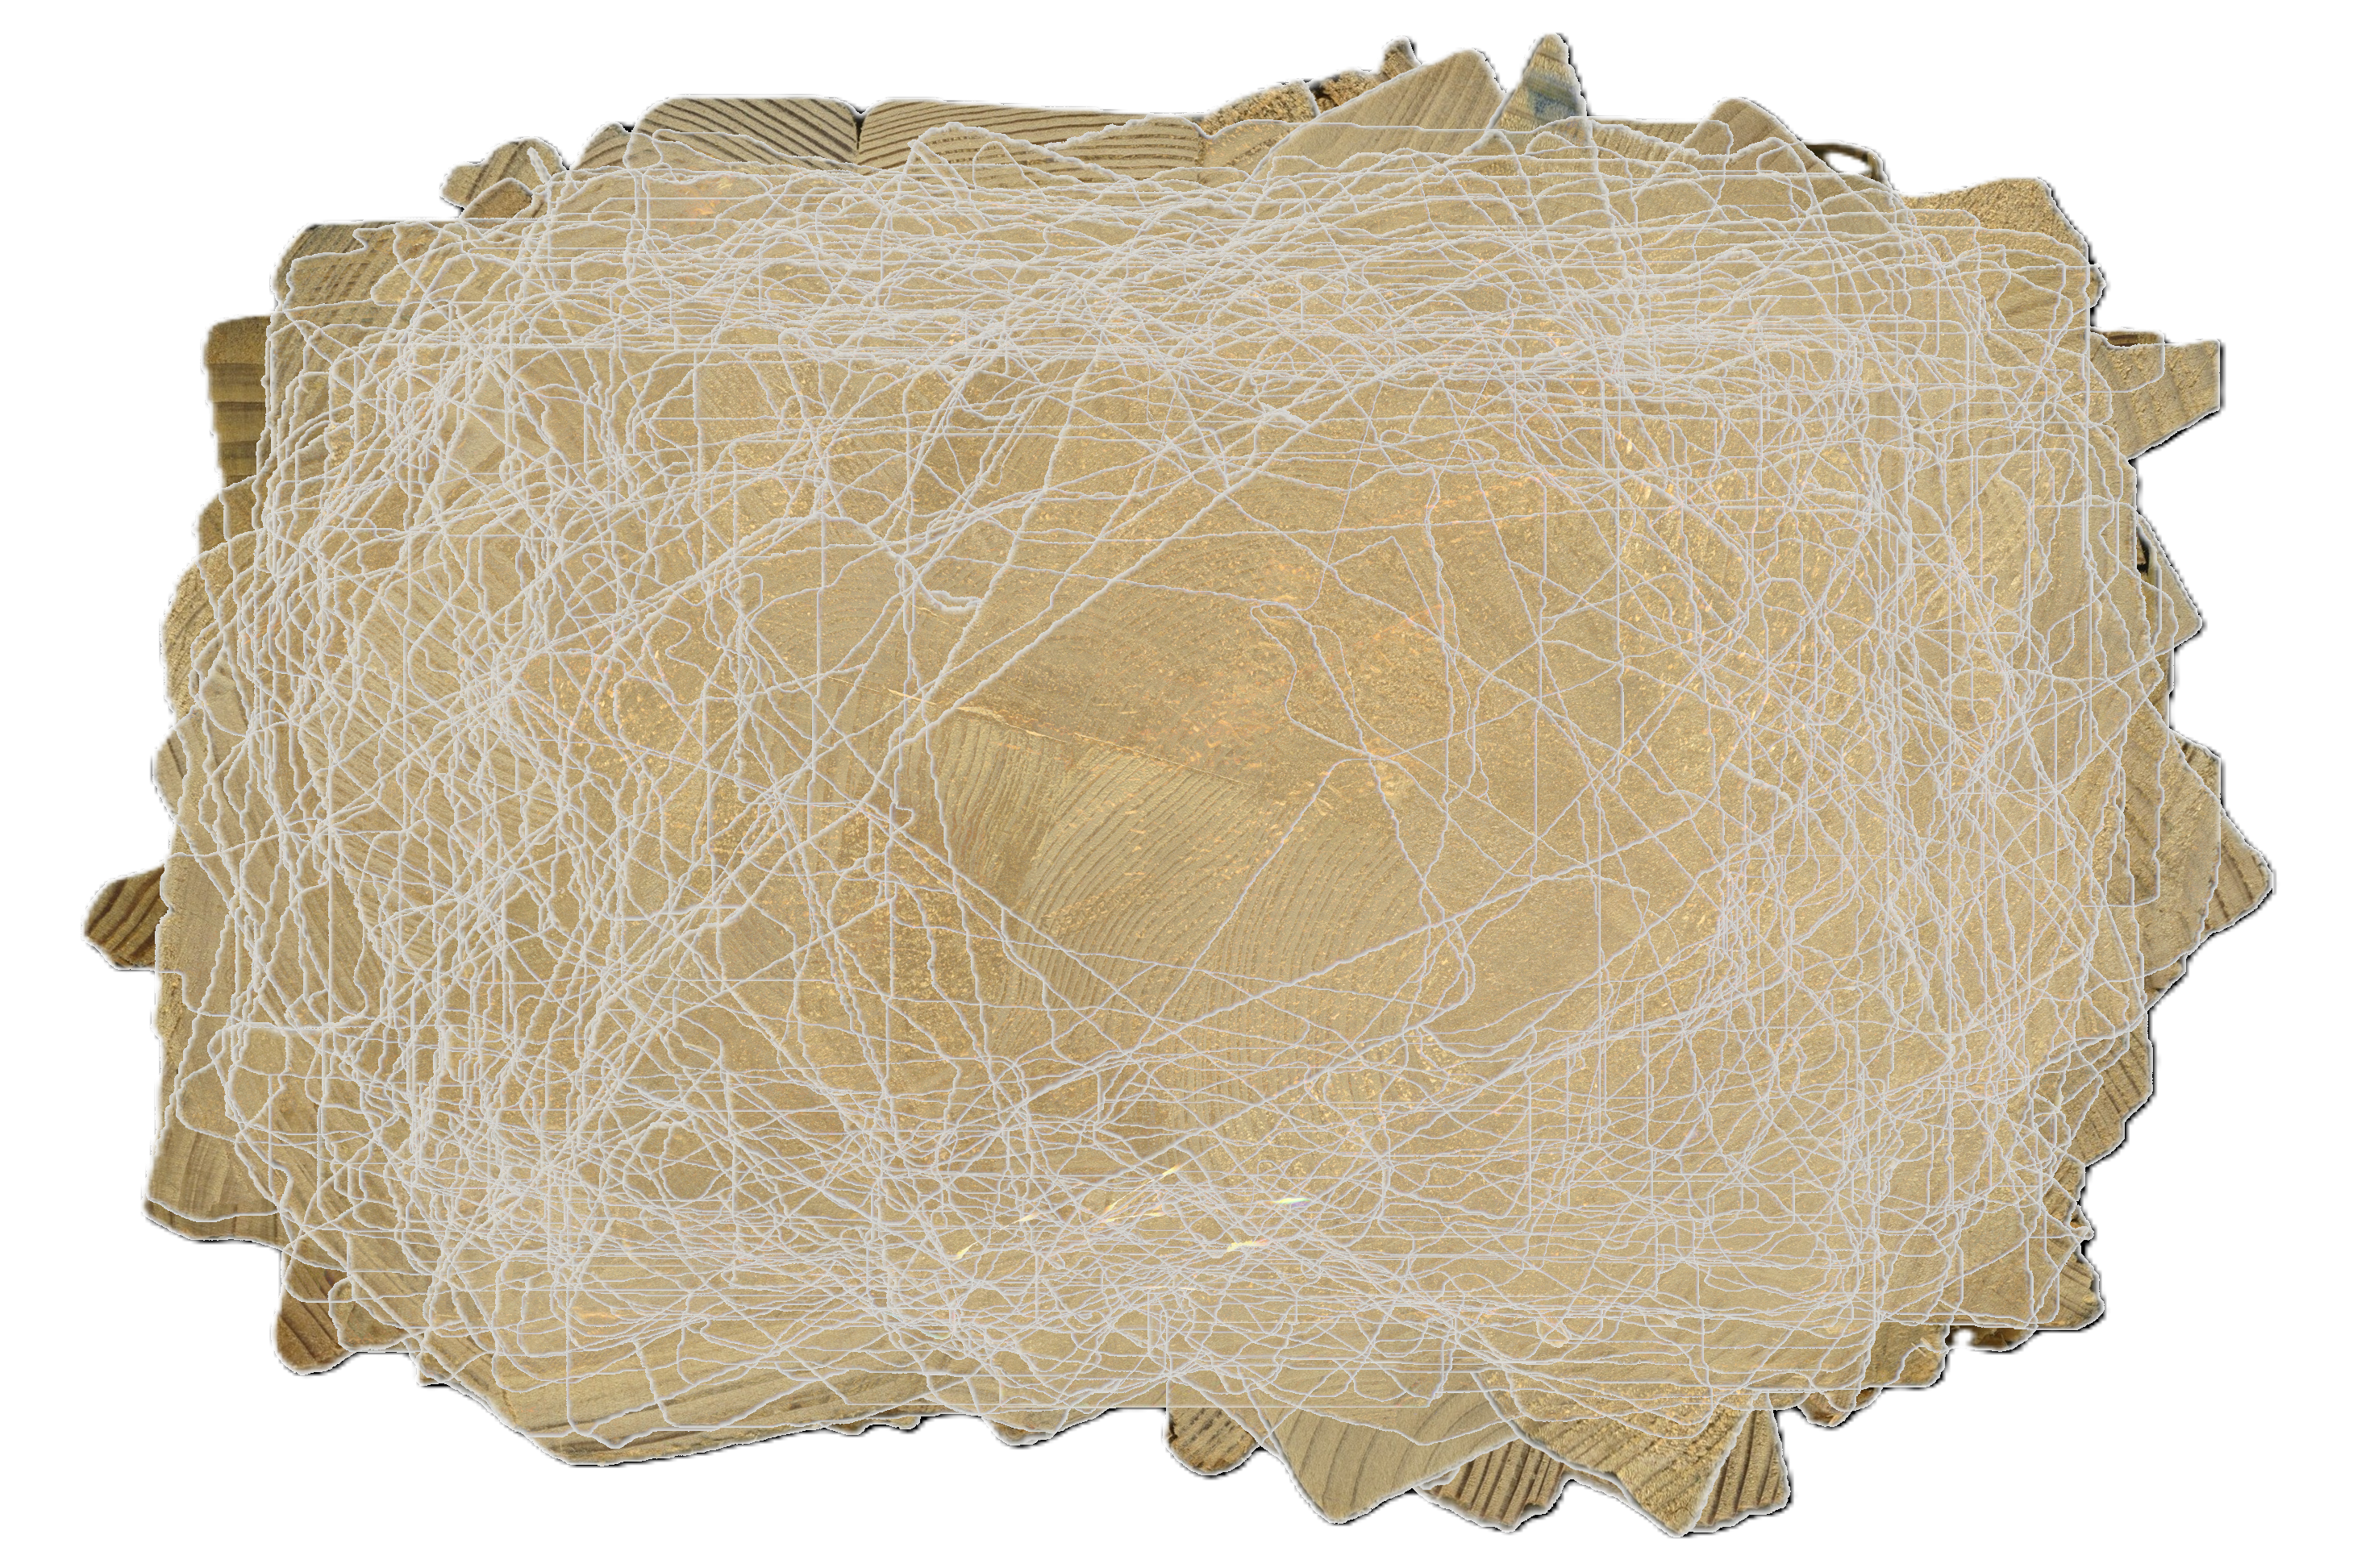
Scanning was slow because I wanted to capture the logs at high resolution, but we had all week to finish, so we took our time. On the drawing side, I traced the contour of each log with a pencil onto a single sheet of paper. I did not erase between tracings. I did not separate them. I simply placed the log down onto the paper and traced again and again, one log after the next, each outline laid on top of the center of the previous tracings.
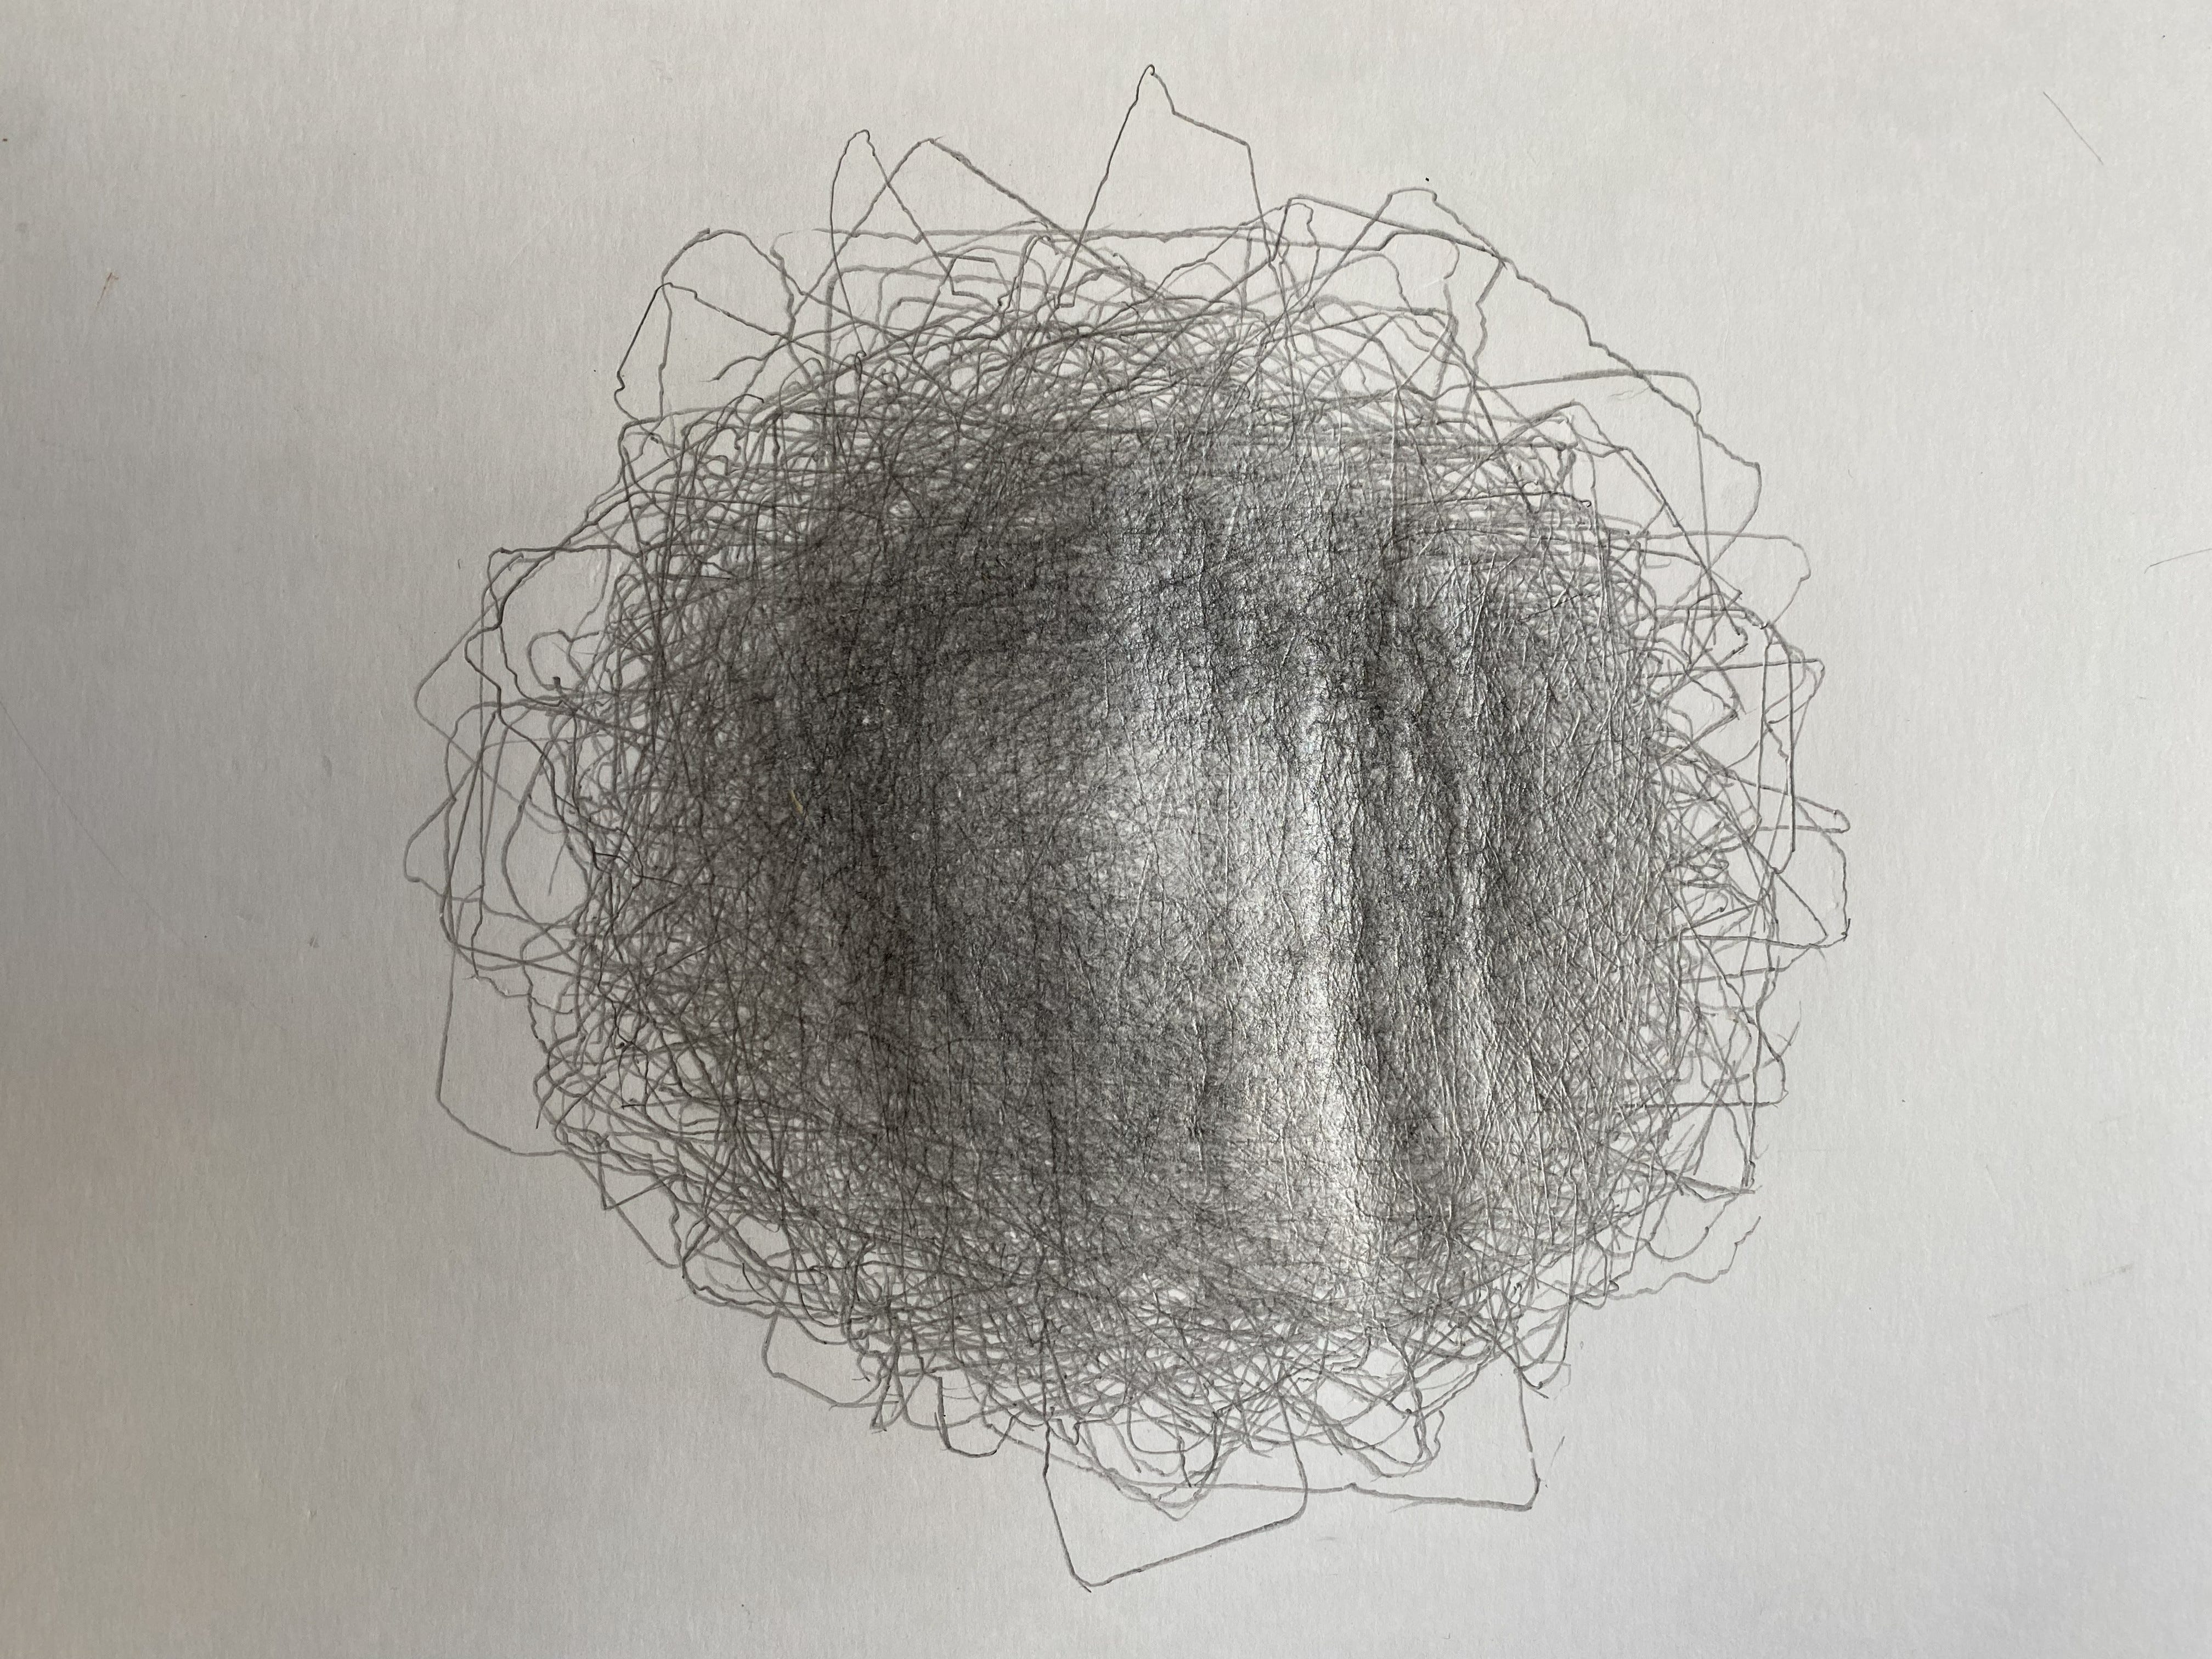
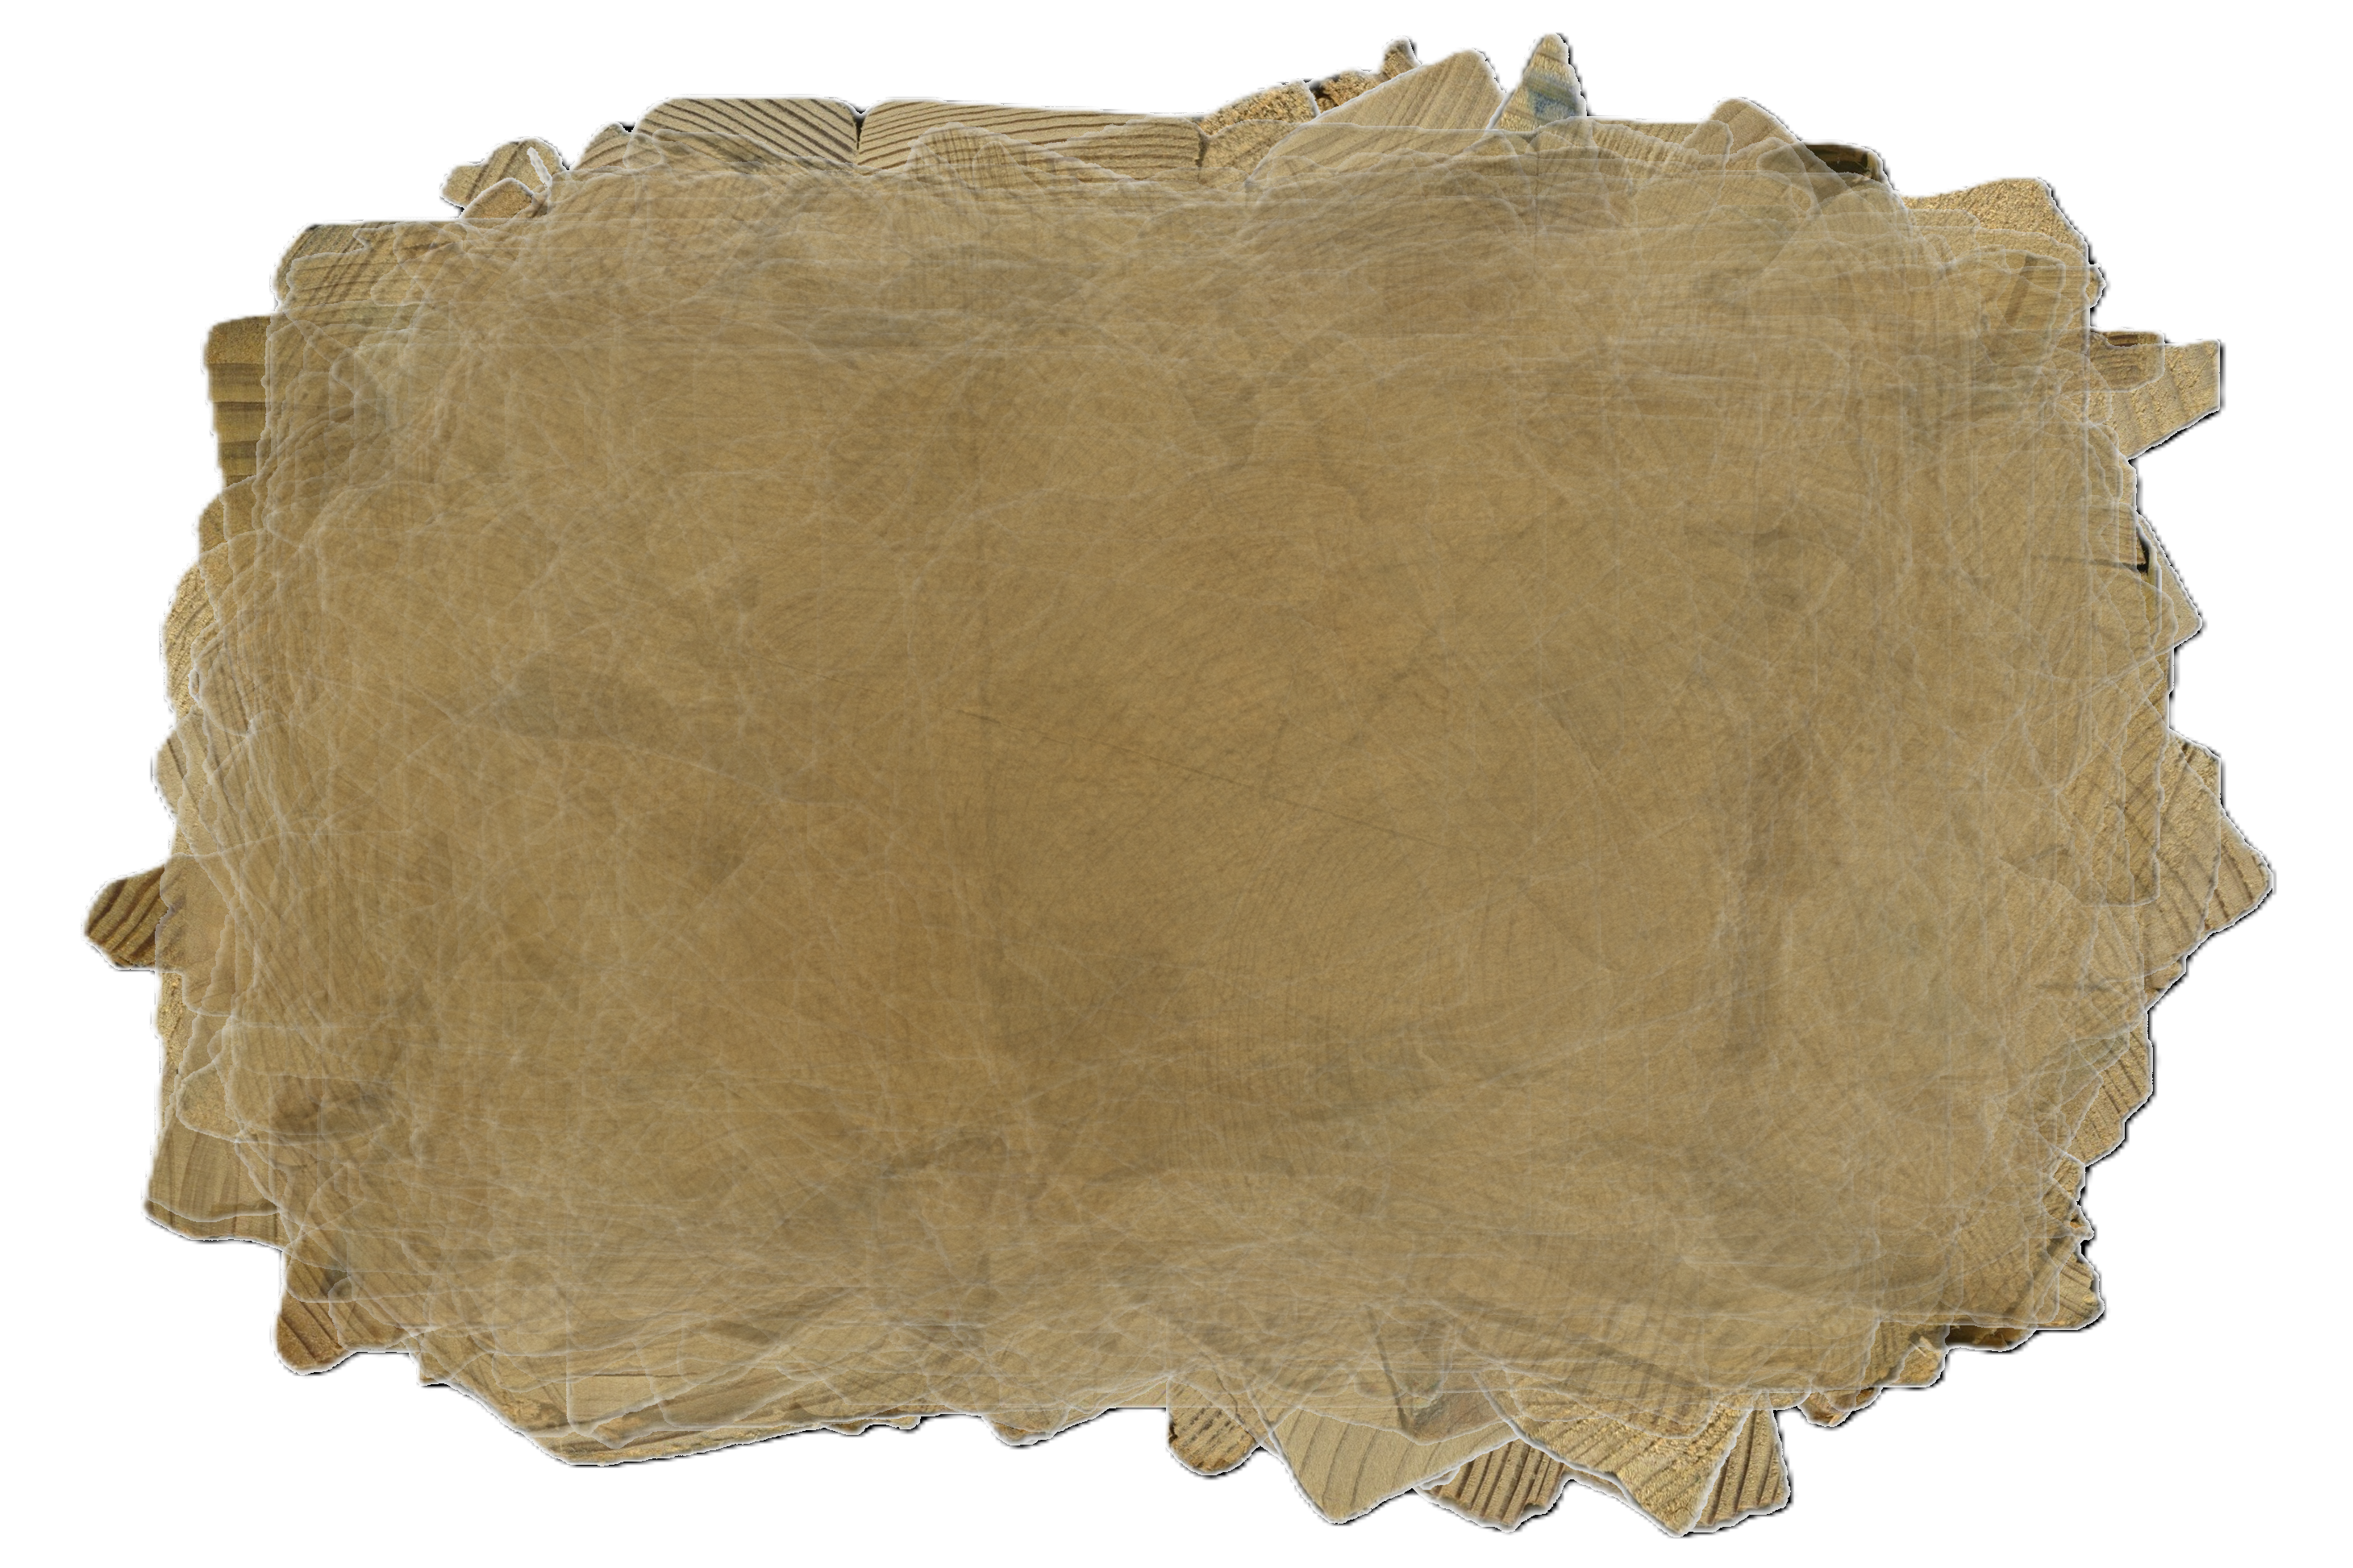
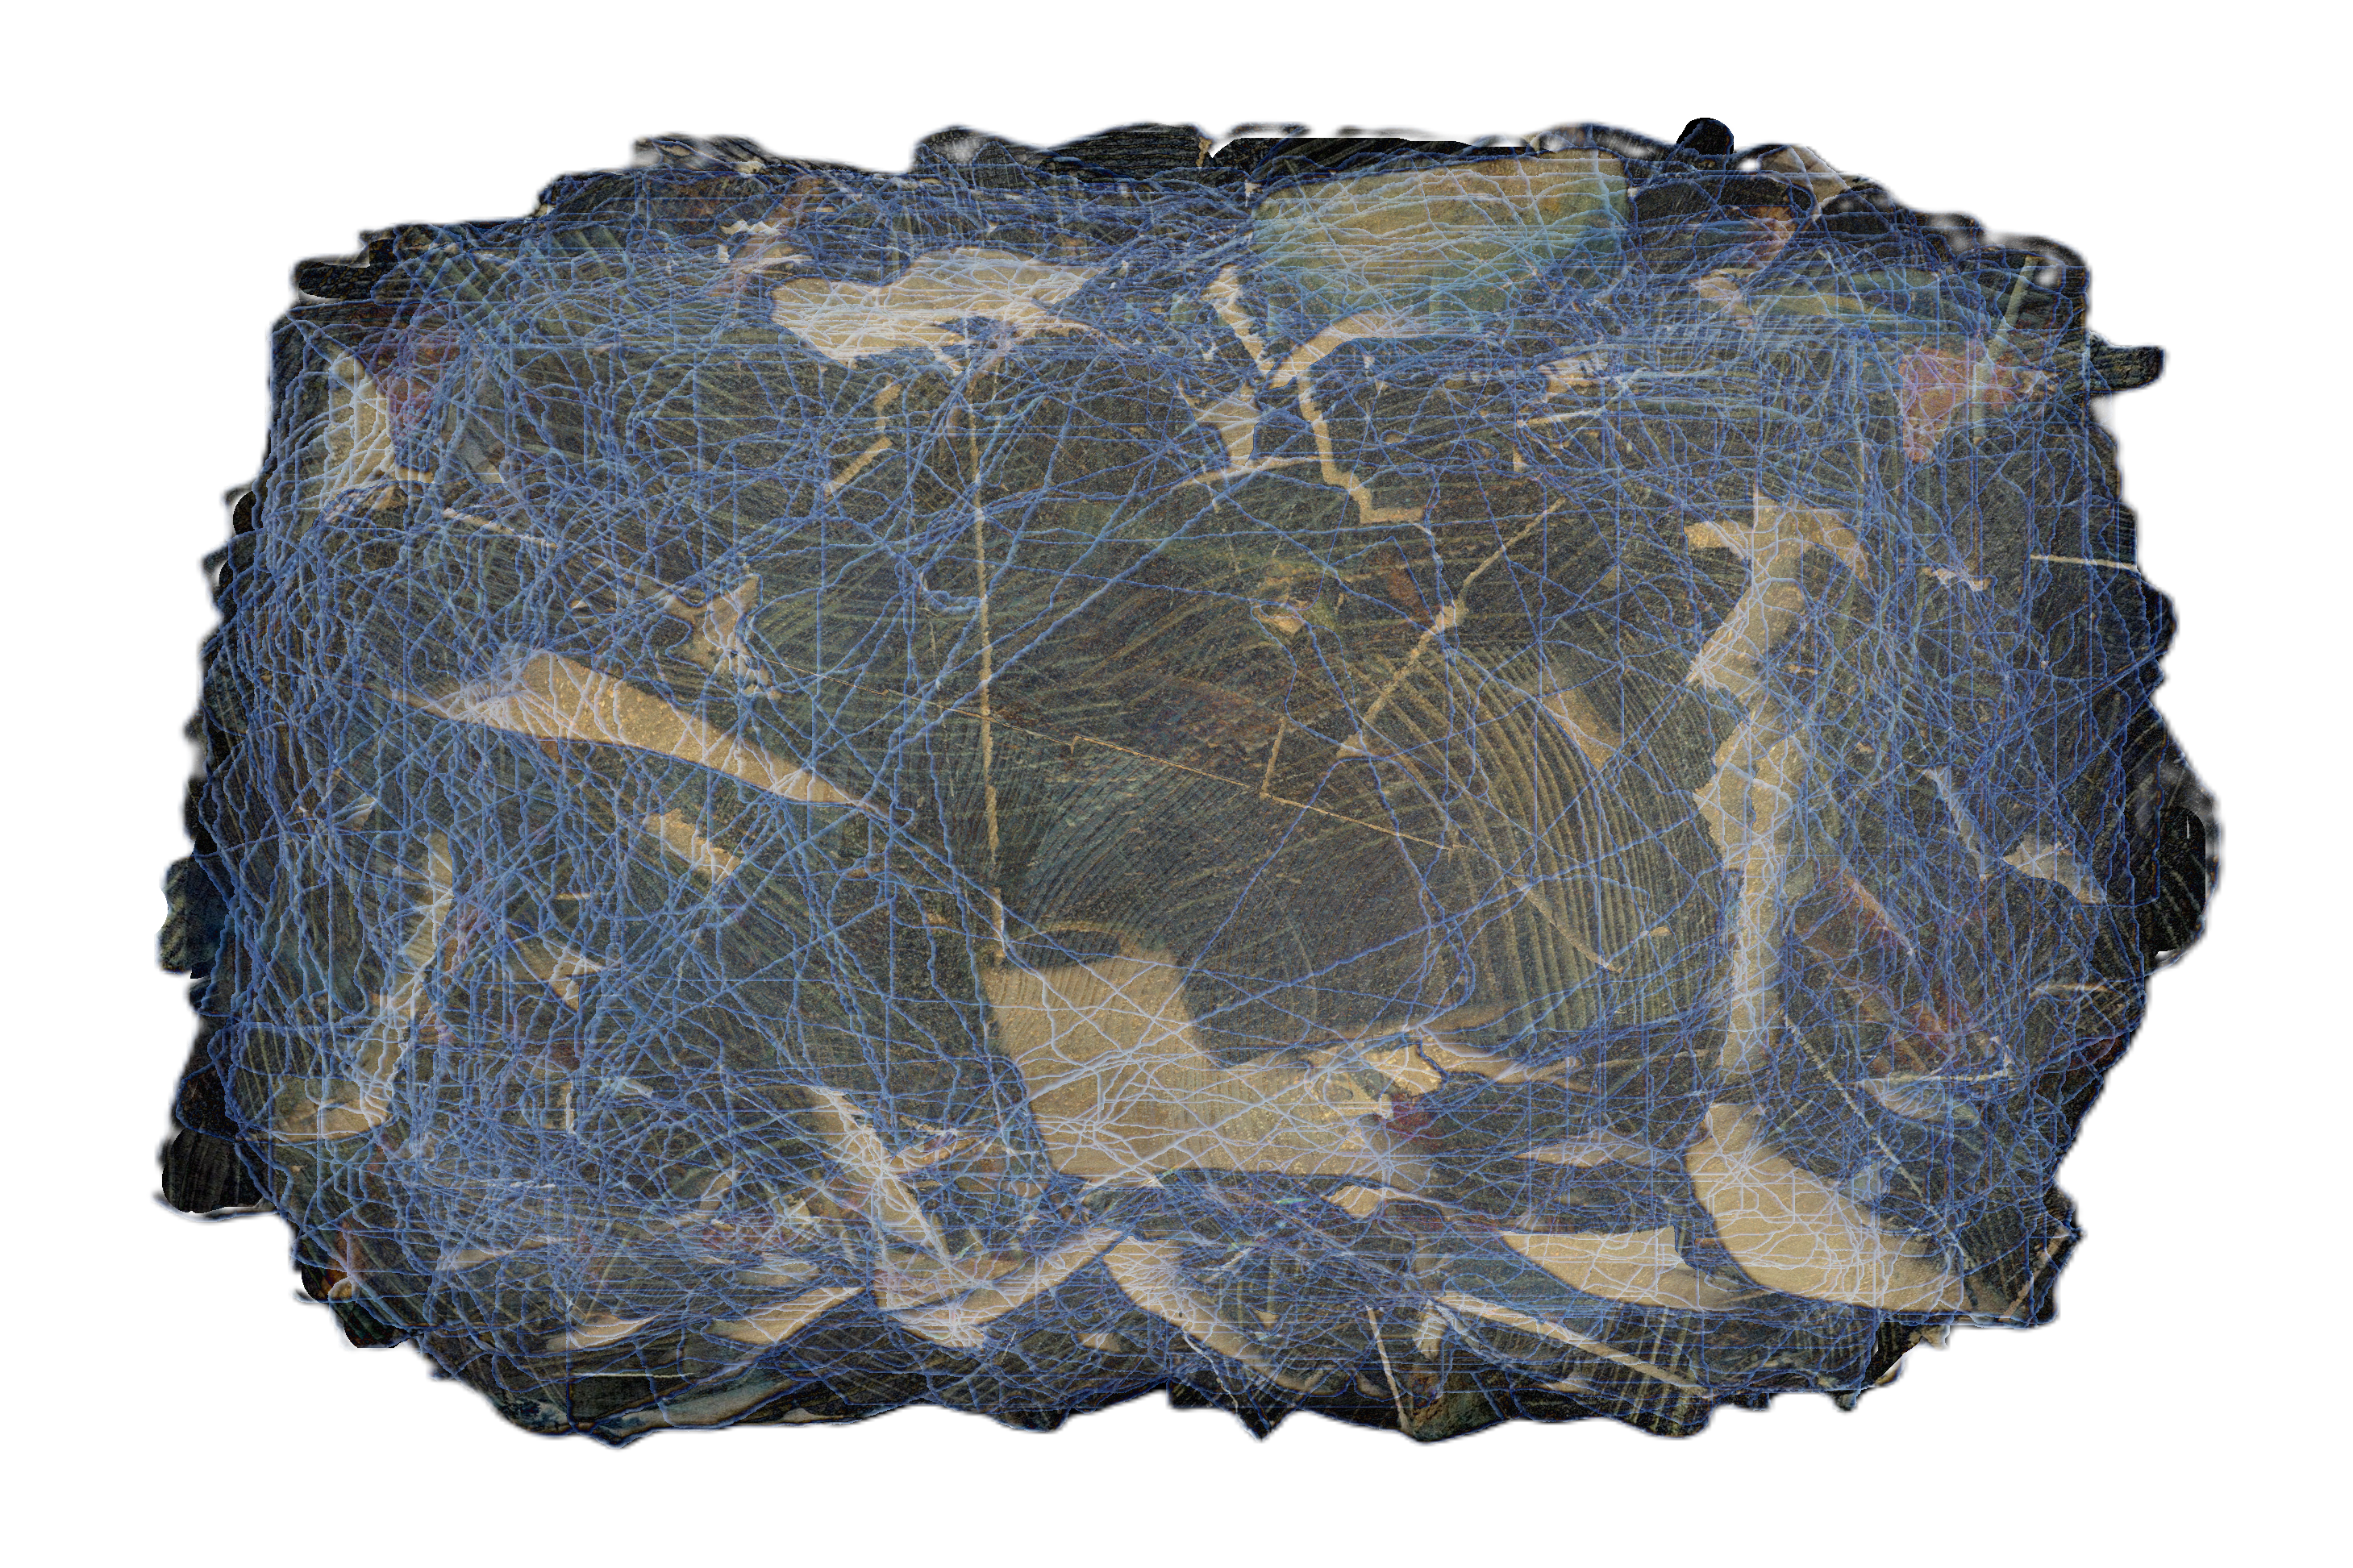
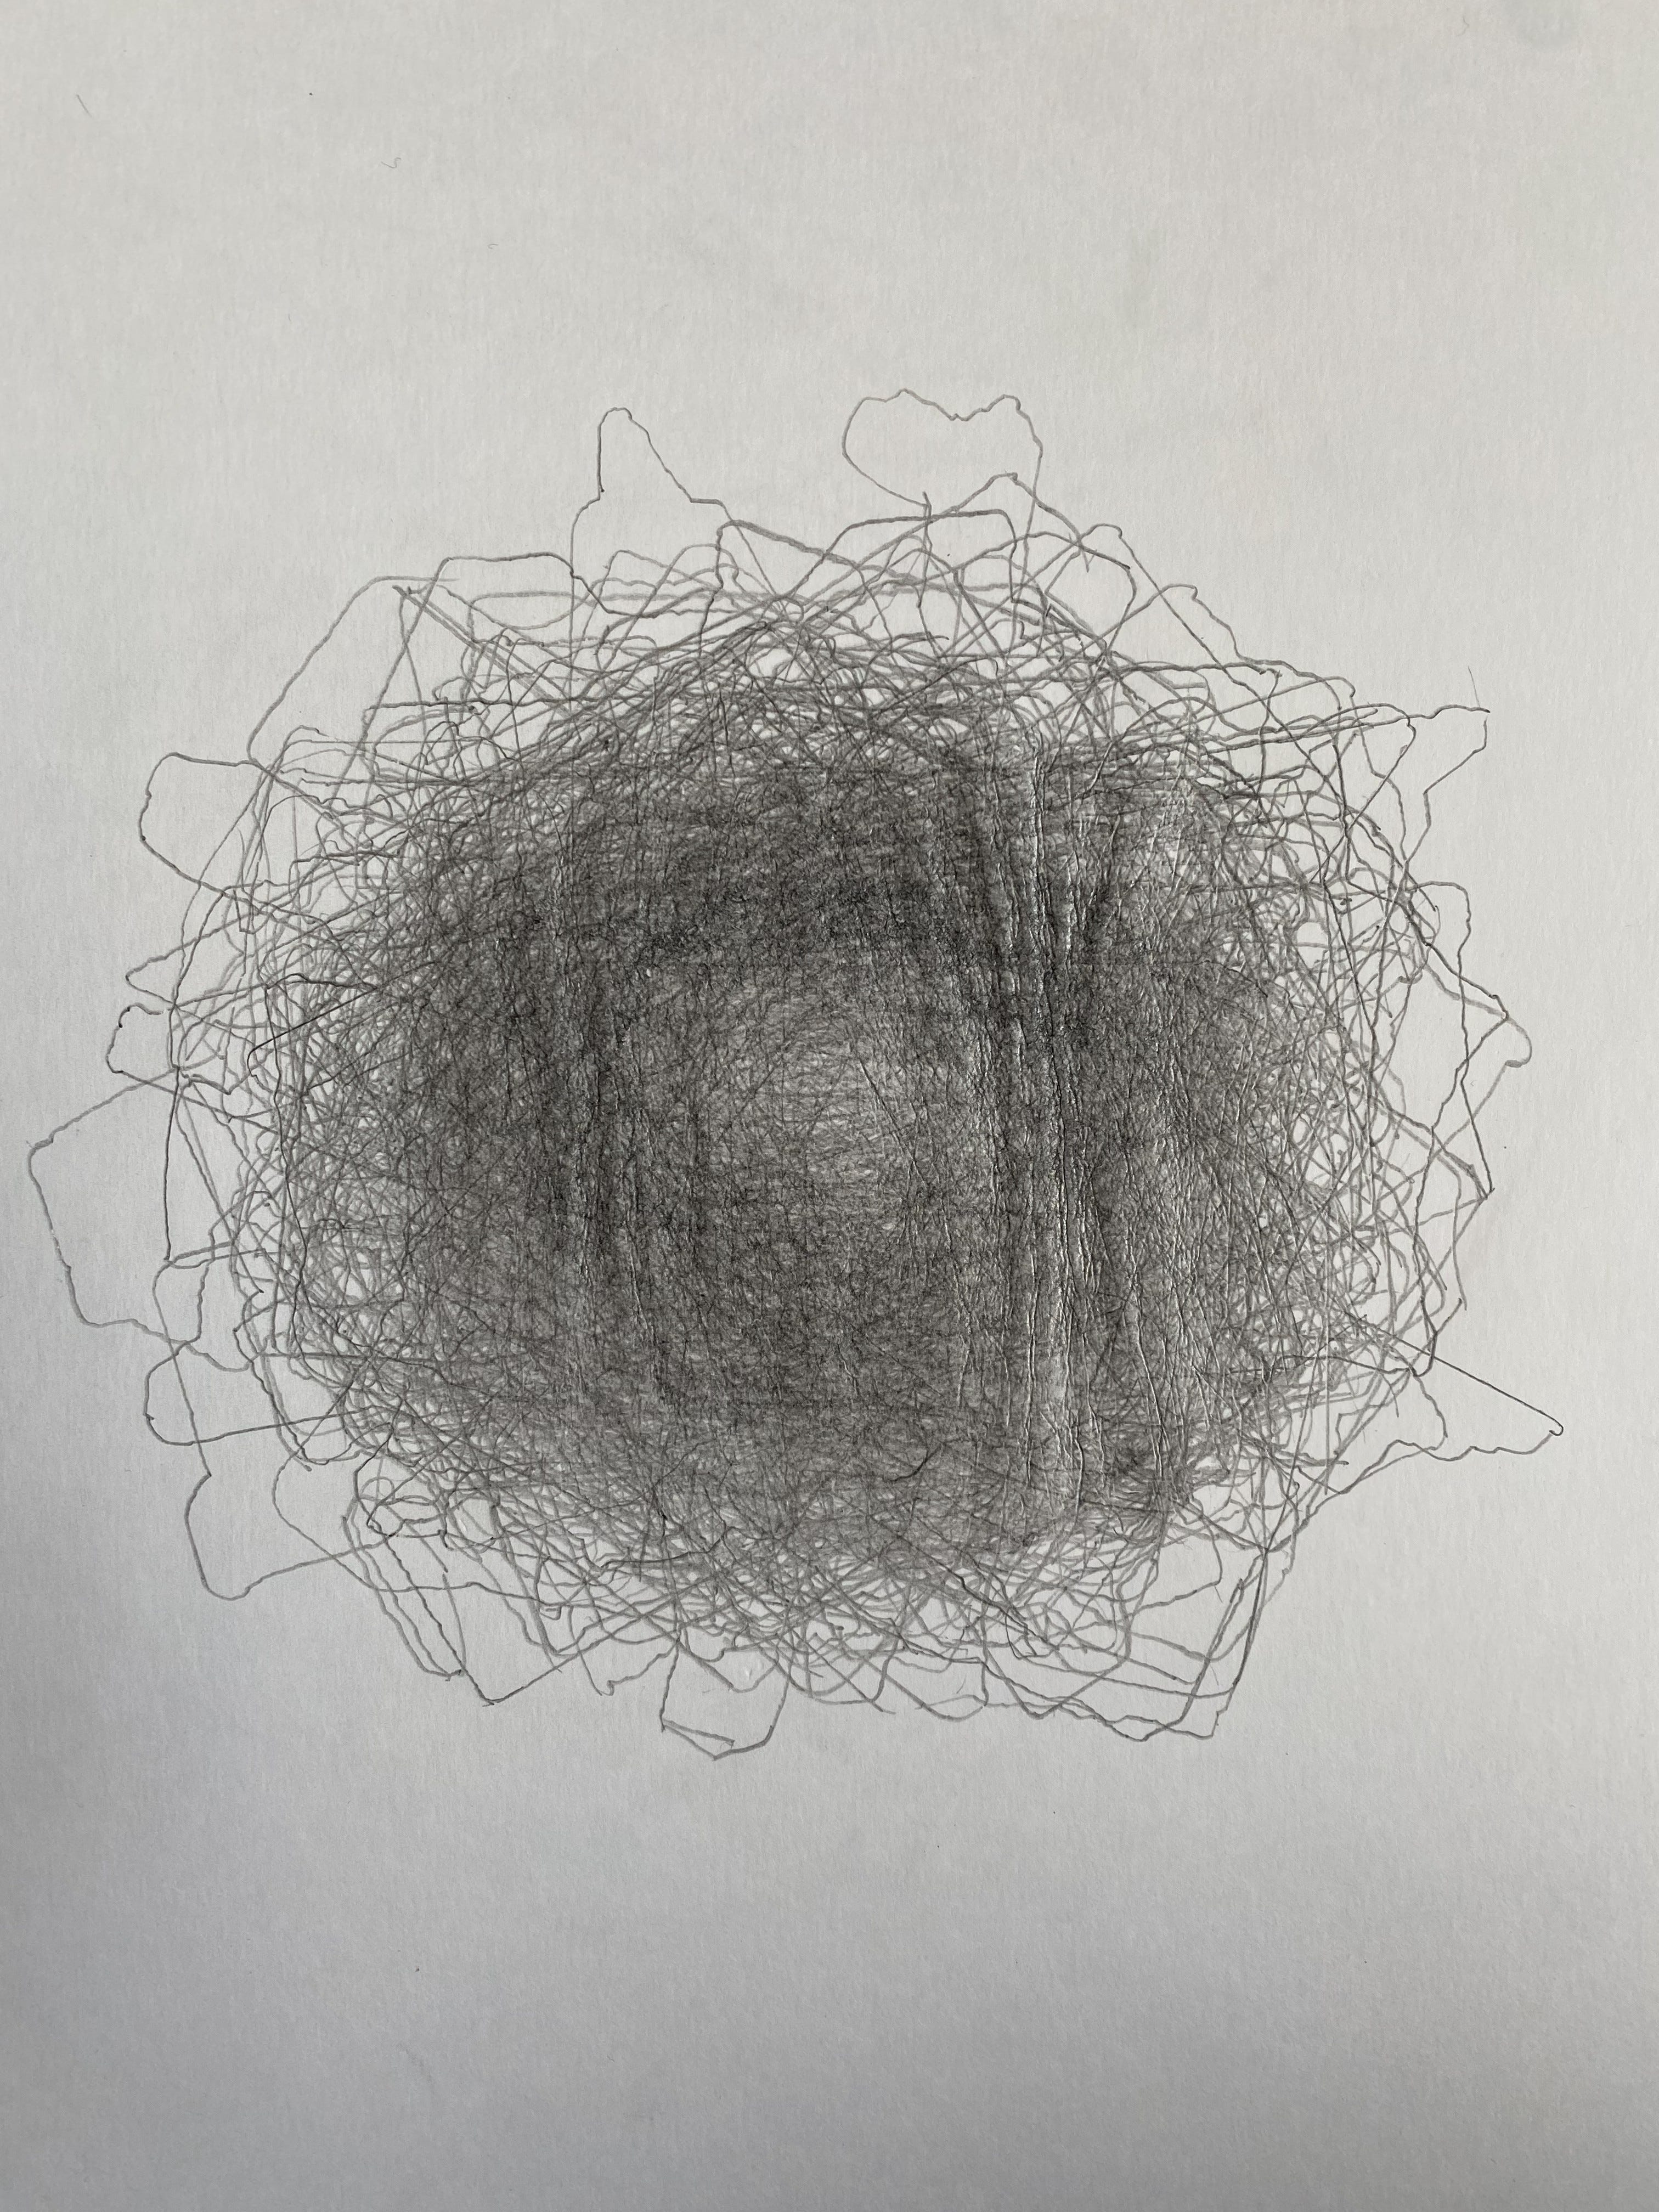
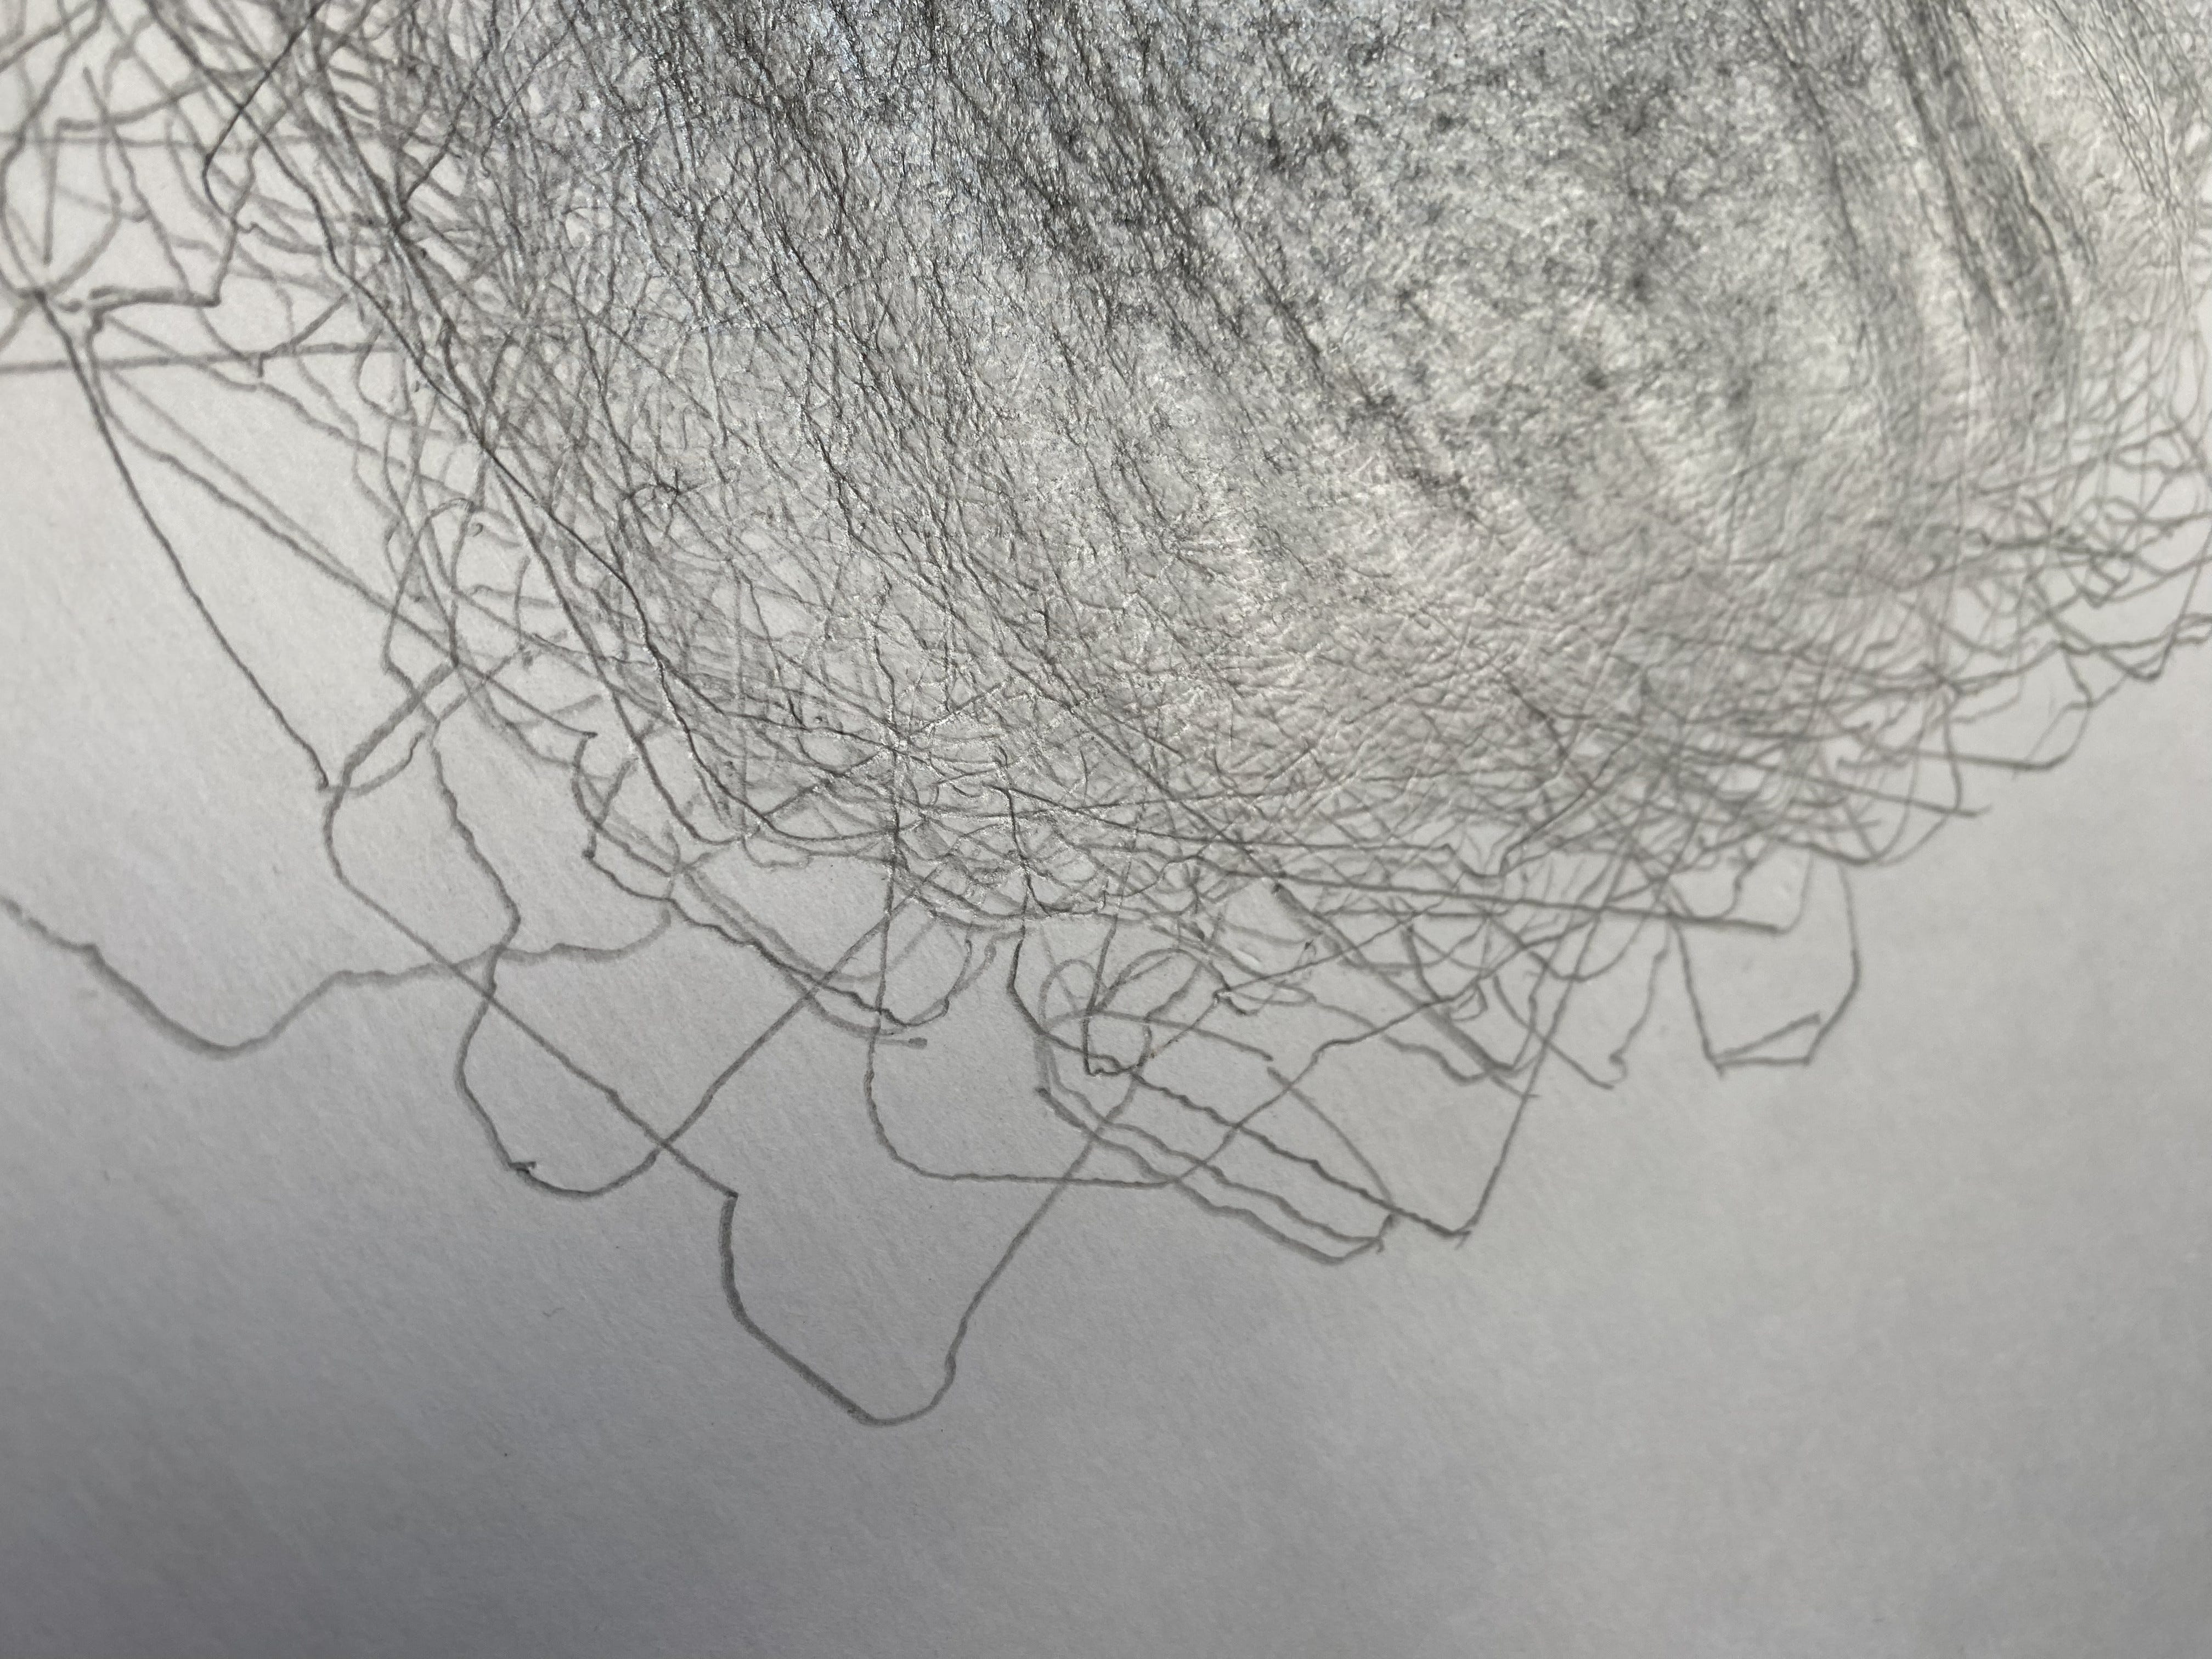
By the end, the paper held hundreds of contours. A dense, darkened taurus where the outlines overlapped most often. Fainter halos where they diverged. Peripheral lines that appeared once and never again. Toning, abrasive fuzzing of the paper from overworking, ridges following the line of the pencil around the object, polygon upon polygon created in myriad intersections of lines crossing and crossing again. The surface of the drawings shimmer with the reflective sheen of graphite, making these drawings difficult to photograph. The paper cupped into a shallow bowl from the repetition of pencil moving the fibers of the paper, wrinkling the drawing in ways that make it impossible to flatten. All of these “defects” are actually indexes to the human hand.
My intent was to draw a standard deviation by hand, but that’s not possible. Actually, these drawings are not statistical operations at all. They do not calculate variance, they do not measure distance from a mean. While you can inspect any particular point of the drawing and you can get a sense of how many times the pencil passed that point from value, tone, and depth, this is not reproducible, or undoable, or forensically calculable. All that these drawings reveal is where my hand returned.
With that understanding, it’s easy to see that the drawing does not record distribution as much as it records the recognizable legibility of accumulation. This is accumulated presence more than it is statistics, the actual embodiment rather than the analysis of the products of my embodiment.
My hand hesitated around tricky corners. Sometimes on easy passes I pressed harder. A slip drifts, but appears corrected when obscured by the tracing of another log. The pencil line contains timing, pressure, fatigue, attention. None of this is noise.
Over hundreds of repetitions, a center emerges, but not because it was computed. It emerges because that region kept being protected again and again inside the center of the nested stack. Critically, my trace drawings differ from the photographs because my traces are outlines and the photographs depict the solid object, so the drawing preserves a hollow texture in the center as a void, turning the density of the image into a taurus form.
The drawing does not tell you what the average log looks like, but it does show you how a form becomes stable through repeated encounter.
This is the difference that matters.
The computational stacks describe the set from a comprehensive view. They answer questions like: where is the center of mass, how far do the extremes extend, how much variation exists and in which direction it leans. They are invaluable for analysis. They tell the truth about the data.
The drawing tells a different truth. It shows how a category forms before it can be named. Before boundaries are defined. Before rules are articulated. It shows how familiarity thickens through exposure.
In cognitive science, this is called prototypicality. Categories are not built from strict definitions but from centers of gravity. We recognize things because they are close enough to what we have seen before. The prototype is not an average. It is a convergence of an exemplar type that becomes the standard for comparison across instances to determine whether or not an instance deserves to be a member of the category, or if it differs enough to form its own categorical center. To translate the Greek with attention to literal equivalence, a prototype is the first sort of a thing, and it defines what is and is not a thing in that category structure for what’s called a centered-set. To use a classic example, when you see enough birds that you can distinguish the pattern and find what is prototypical, you end up grounding the category “bird” with the image of the bird with the highest statistical frequency. The prototype varies depending on the region of the world, where I am in the Great Lakes a prototypical bird might be a robin. When I lived in Papua New Guinea it was the bird of paradise (incidentally, last night I dreamed of cassowaries, a deadly flightless bird that runs around the jungle). This variation in prototype is because the category structure is reliant on frequency of entities being grouped, and so the cluster is prototypical.
My log drawings perform that convergence materially. The darkened core donut ring shape is not the mean log. It is the place my hand most often encountered a log and described the edge of a log with the pencil. The peripheral lines are not outliers to be excluded. They are part of the memory of the form that I was tracing.
This is where the human and the machine diverge.
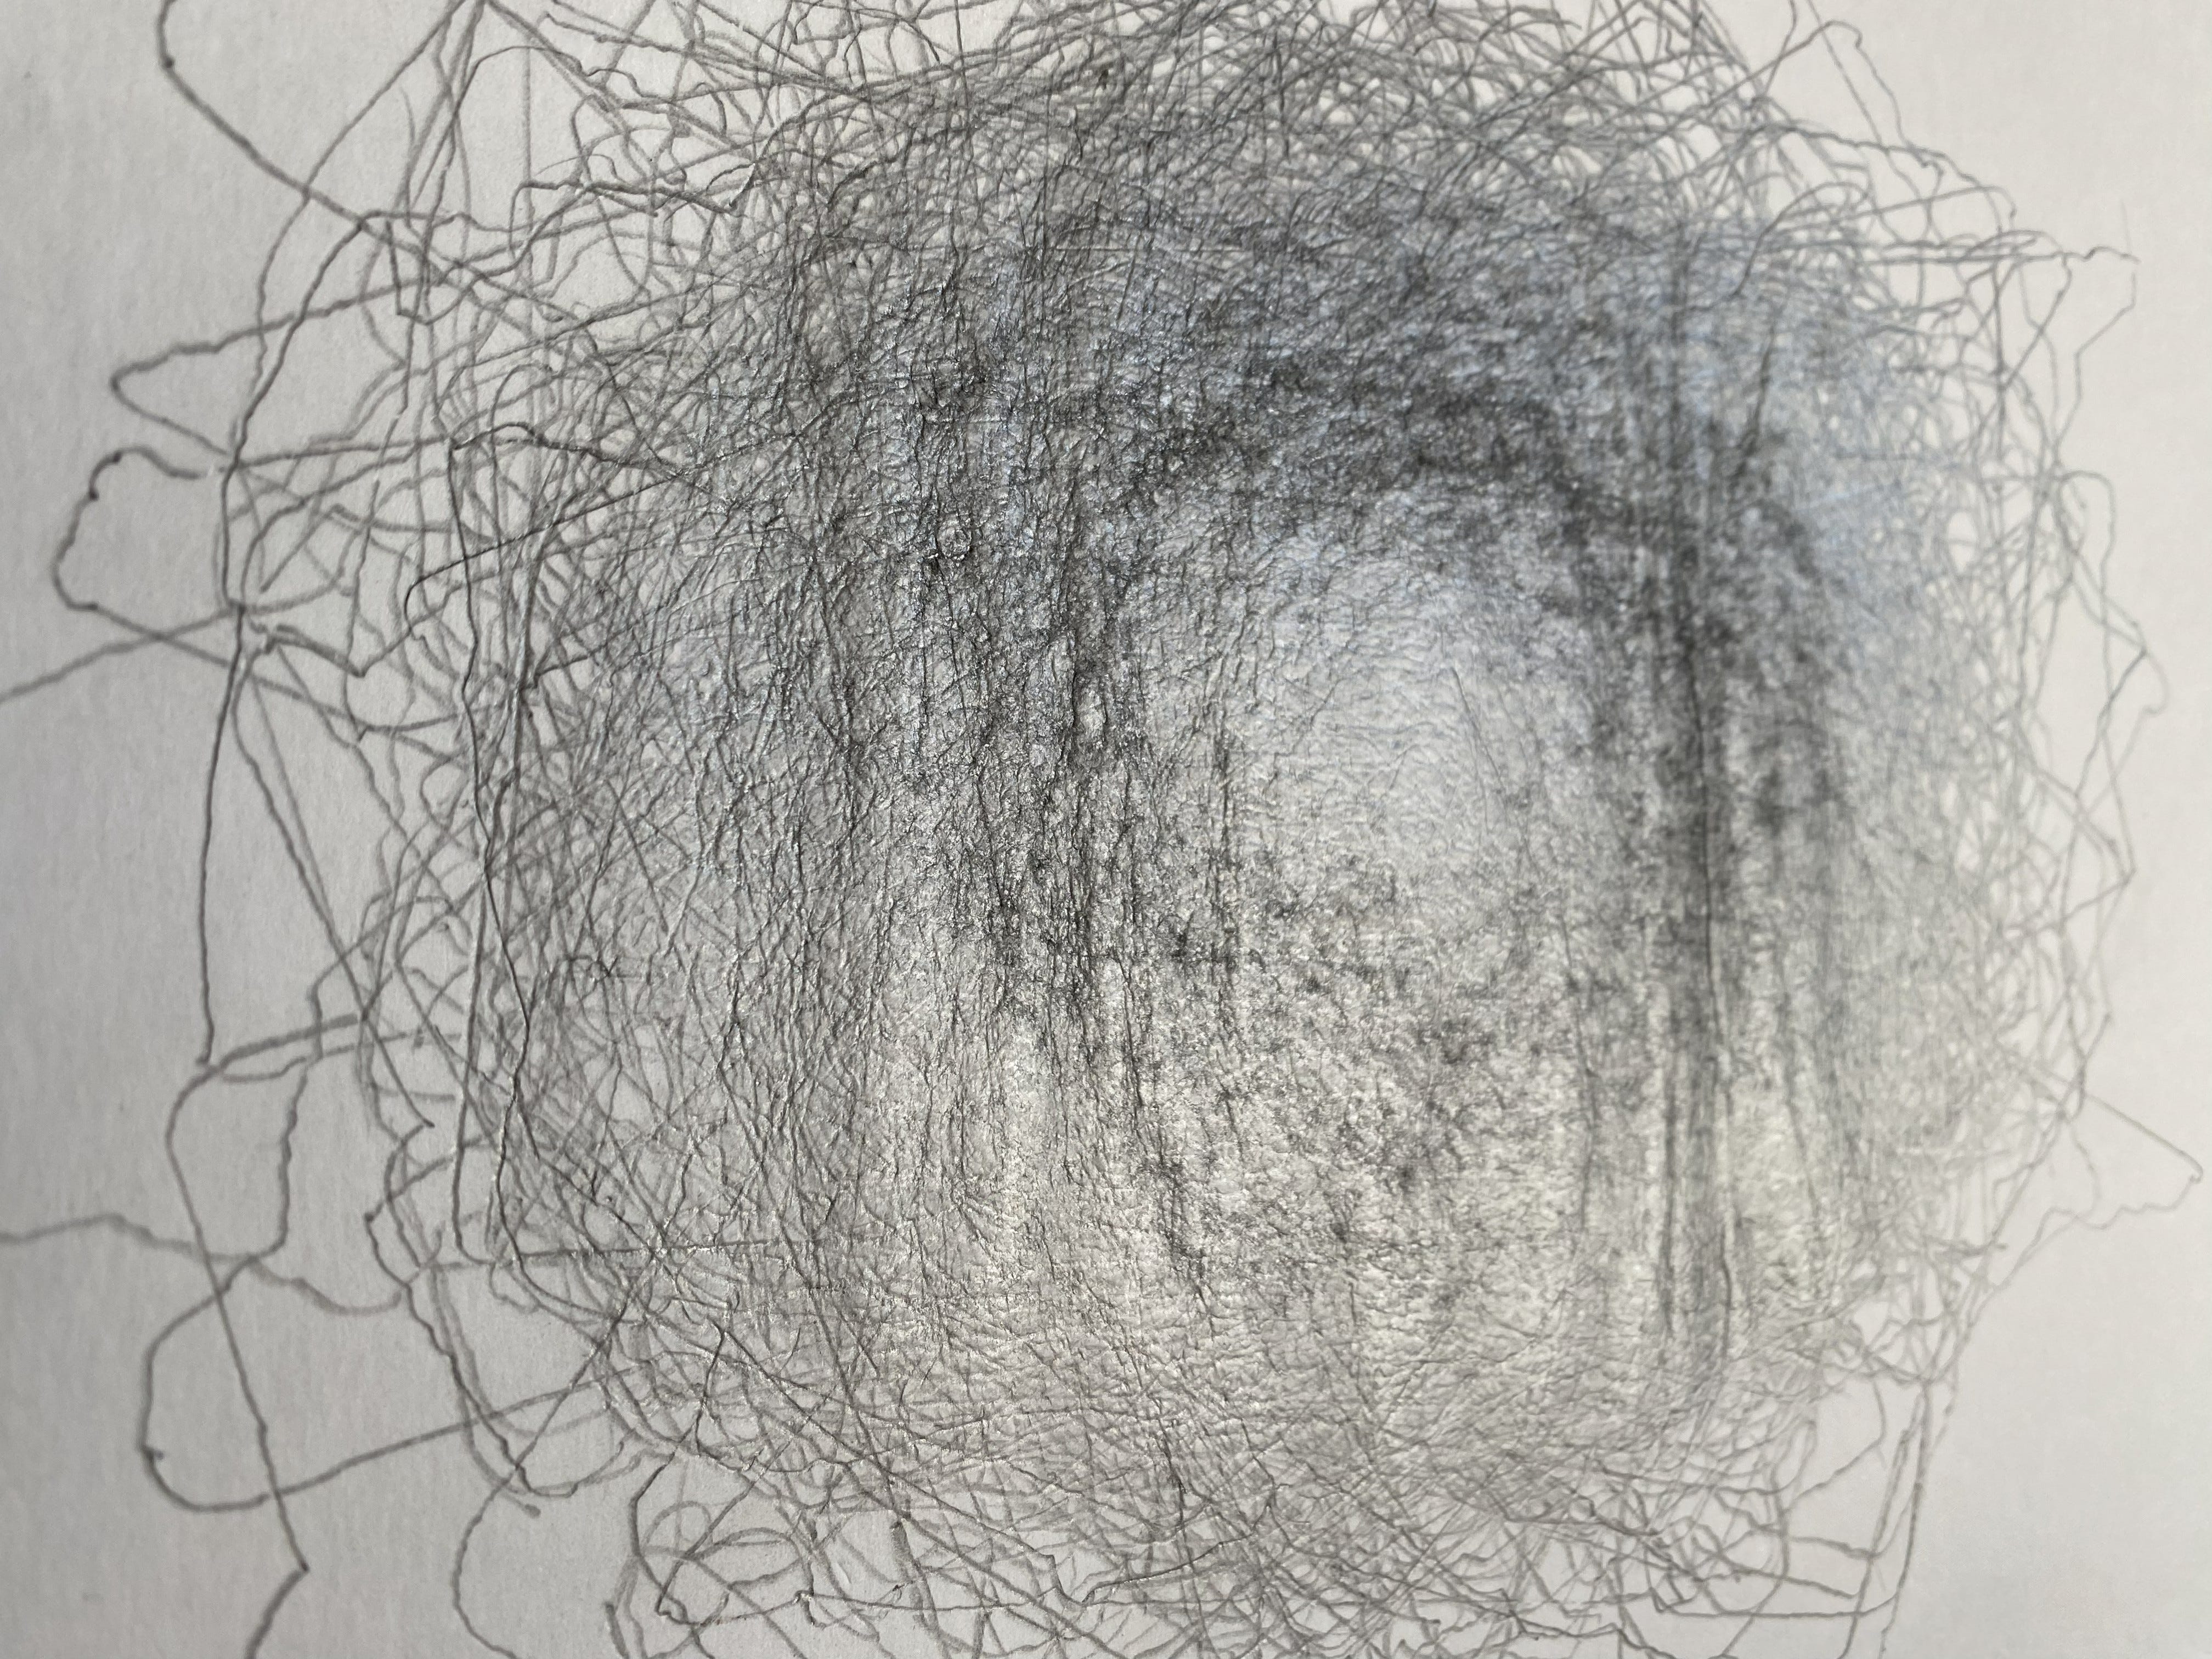
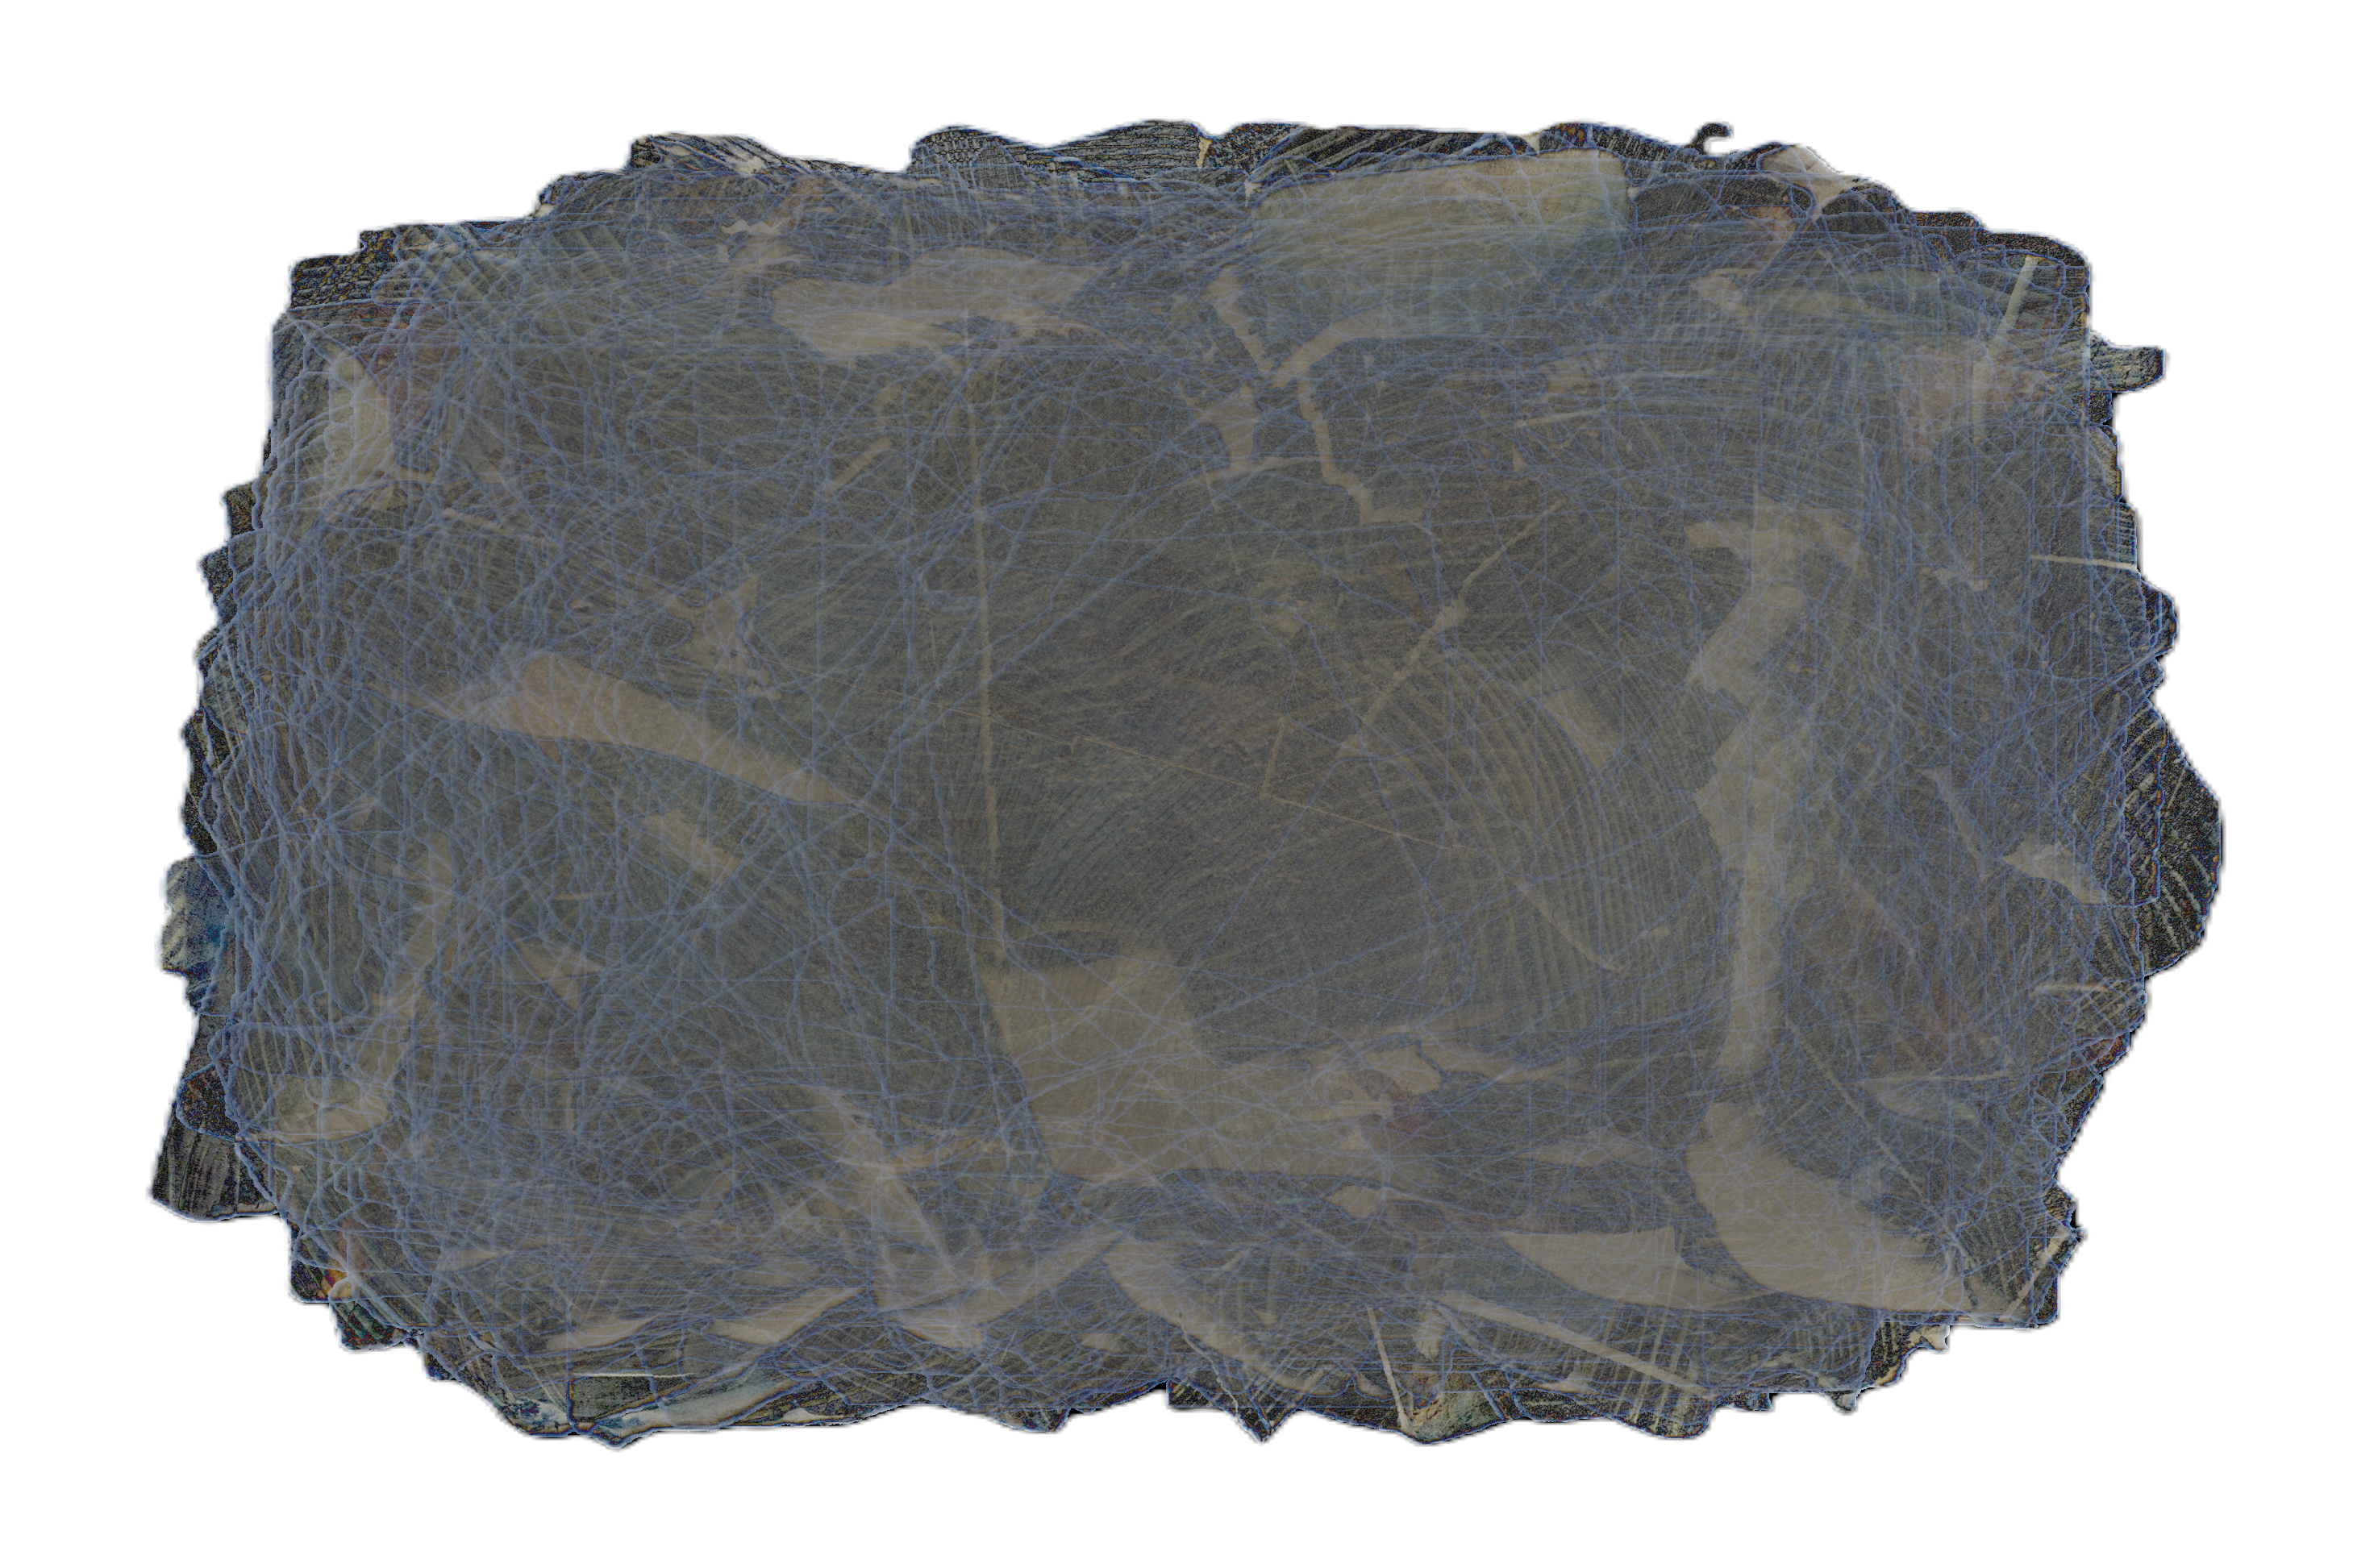
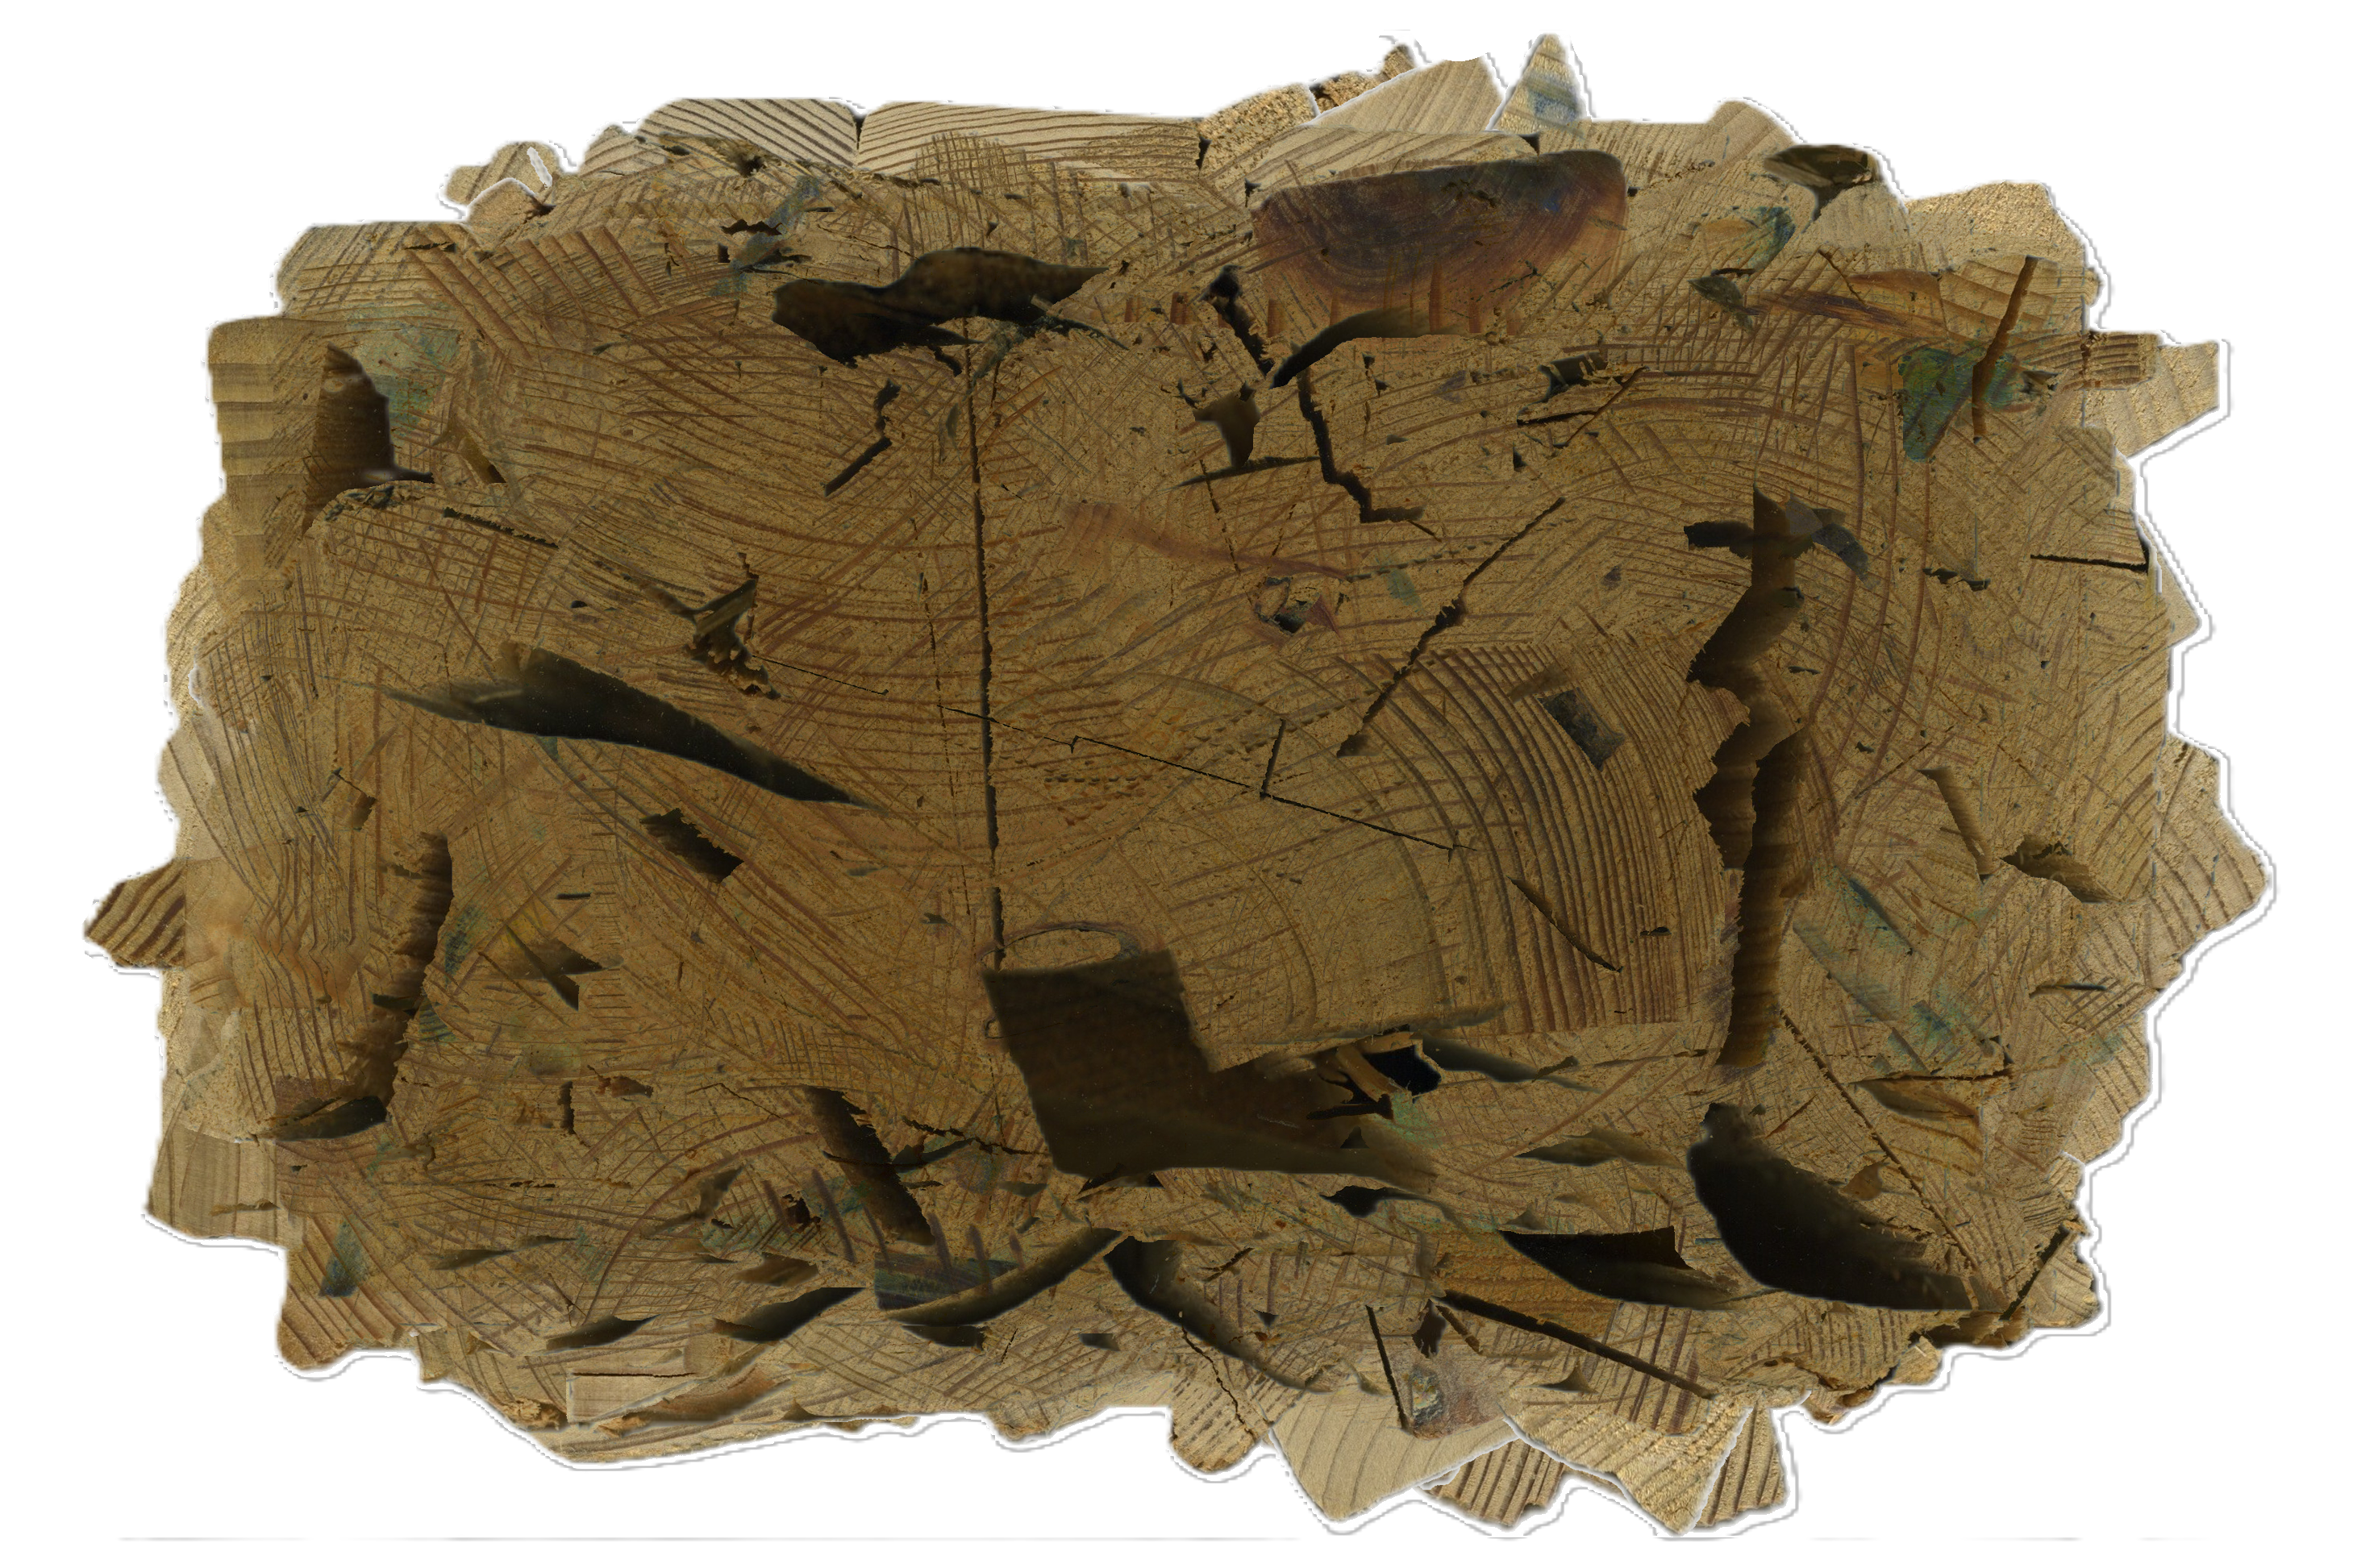
The machine has perfect recall and no experience. It can store every image and compute across all of them without fatigue, and do it across all pixels for the full depth of the stack. But it does not “remember” in the way a body does. It does not accrue familiarity. It does not learn a form through repetition. It only evaluates it, and re-presents it to us in visualizations, often in compressions we can’t experience in real life. For instance, this minimum stack analysis where the annular growth rings bleed through the stack to produce a crossing of growth rings impossible to visualize without computation:
The drawing, by contrast, forgets constantly. Each trace overwrites the previous ones imperfectly. Memory here is not storage as much as it is sedimentation. What remains is what was returned to most often. The drawing is chronological. It is a time-stamp of what came before. What is underneath is before, what is above is most recent. This is accretion, like dust piling up. The relationship is prepositional (like all of my work if you read closely).
Seen together, the stacked images and the drawings are not redundant. They are complementary. One explains variation. The other explains recognition. One models precise difference between instances of the type. The other records how sameness emerges across instances of the type.
I originally thought I was making a picture about these logs. I was not.
I was making a picture about how knowledge takes shape. About how categories form not through calculation alone, but through repeated, embodied contact. About how memory is rhythmic, not archival. About how meaning thickens where attention keeps landing.
I’m not saying the machine visuals aren’t useful or interesting, I like them as visuals and will exhibit them in future installations of Everglades Cord, but I had a lot more fun making the pencil drawing by hand, because while the machine gave me clarity, the drawing required actually engaging the object. I learned more about the logs phenomenologically than I could statistically. Still, both are necessary to get a complete picture.
As an artist making objects, I don’t actually often develop images with my hand. I sketch, I diagram, and I use drawing as a tool, but I don’t often use it as a medium. So when I was in the process of tracing the objects I was using body motions familiar to me in the techniques of tool manipulation. Some artists might contend with this as a drawing since I traced shapes on top of shapes, they might disagree with how I categorize the output of the action as a drawing. But I factually “drew” this because I pulled the pencil around the forms and toward myself which is a primal act that we acquire as we sense make in the world as infants, drawing things toward ourselves to inspect them and learn them. Of course, I also draw tools like blades toward myself all the time in the manipulation of wood and stone and metal, so drawing a pencil toward myself has the same benefit of precision in laying down an accurate line as does the cutting edge of a blade pulling through wood, and I’m very practiced at that. It’s a drawing. It’s precise. But it’s definitely human, even if it was assisted by the template of the log contours being traced. Here we’re back at categorization, when a bird is seen more frequently than another it becomes prototypical. This frequency-dependence transcends domains; what is prototypically a drawing to a 2D artist and what is prototypically a drawing to me derives from frequency. If I keep writing, laying line down after line, I worry the stack of concepts will destabilize, so I’ll wrap it up.
The hand-made drawing here records where form and gesture intersect, marking each encounter as it happens, while the statistical stacks treat the forms as a population, analyzing variation and consistency across the whole set. I hope this work is received less as a comparison of skill or precision and more as an invitation to engage openly, to witness the human rhythm embedded in the act of mark-making.
RYAN DEWEY
Everglades Cord is available for institutional loan and scholarly circulation by arrangement. Enquiries from museums, research institutions, and curatorial contexts are welcome.